13.3 Setting FFT Analysis Conditions
216
The averaging function calculates the average of the values obtained from multiple measurements of a peri-
odic waveform. This can reduce noise and other non-periodic signal components. Averaging can be applied
to a time-domain waveform or to a spectrum.
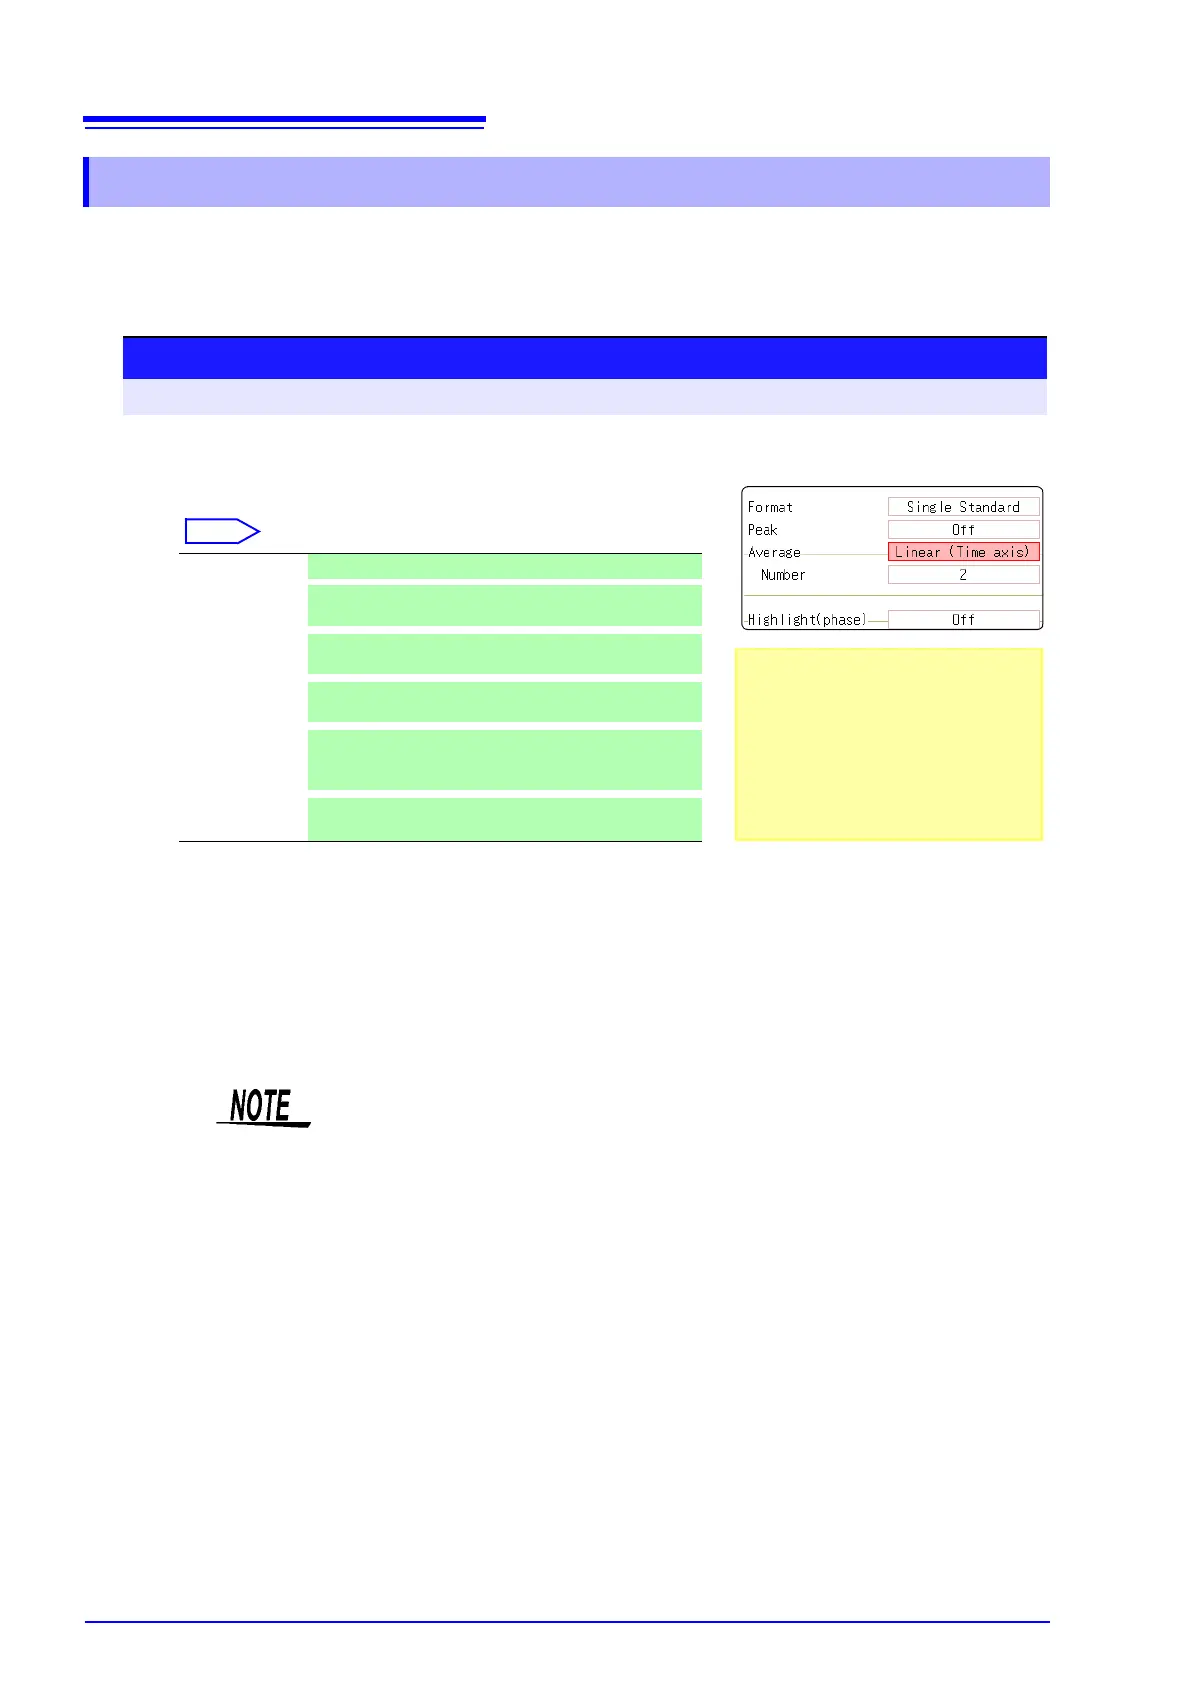
13.3.7 Averaging Waveforms
1
Enable averaging.
Move the cursor to the [Average] item.
2
Select the count for averaging.
Move the cursor to the [Number] item.
Select the number of measurements to be averaged.
Setting range: 2 to 10,000
Off Averaging is disabled. (default setting)
Linear
(Time axis)
Time-domain waveforms are summed and averaged
and then calculation is performed.
Expo.
(Time axis)
The exponential mean of time-domain waveforms is
determined and then calculation is performed.
Linear
(Frequency)
Frequency-domain waveforms are summed and aver-
aged and then the calculation result is output.
Expo.
(Frequency)
The exponential mean of frequency-domain wave-
forms is determined and then the calculation result is
output.
Peak
(Frequency)
The maximum value of frequency-domain waveforms
is retained.
Procedure
To open the screen: Press the STATUS key → [Status] sheet
About averaging calculation formulas
See: "Averaging"(
p.A21)
When averaging and auto saving or
auto printing are enabled at the same
time
Data is saved or printed after the specified
count of values have been averaged.
See: "Trigger Modes and Averaging"
(
p.218)
1
2
• After measuring with averaging enabled, display is not available when the
channel is changed. Also, when the analysis mode is changed, the analysis
modes that can be displayed are limited.
• When averaging is performed with the analysis mode disabled (Off), no trace
is displayed when the analysis mode is changed after measurement.
• When [Format] is set to [Running spectrum], [Average] cannot be set.