13.3 Setting FFT Analysis Conditions
217
13
Chapter 13 FFT Function
FFT Analysis Modes and Averaging
When averaging time-domain waveform values:
Waveforms are acquired and averaged within the time domain. After averaging, FFT
calculation is performed.
When the trigger mode is [Auto]: Data is acquired when the START key is pressed,
even if trigger criteria are not met after a certain interval. So if averaging is applied to an
asynchronous signal, the resulting data is meaningless.
Synchronous signals have better SNR (signal-to-noise ratio) and are more suitable for
analysis.
When averaging spectrum values:
Acquired data is first subject to FFT analysis. After analysis, averaging is performed
within the frequency range, and the result is displayed. This differs from time-domain av-
eraging in that averaging can be performed without trigger synchronization. However, if
the characteristics of the input waveform allow triggering, using the trigger for synchro-
nization is recommended.
Spectrum peak hold:
After performing FFT calculations on the acquired waveform, peak values are retained
(held) and displayed within the frequency range.
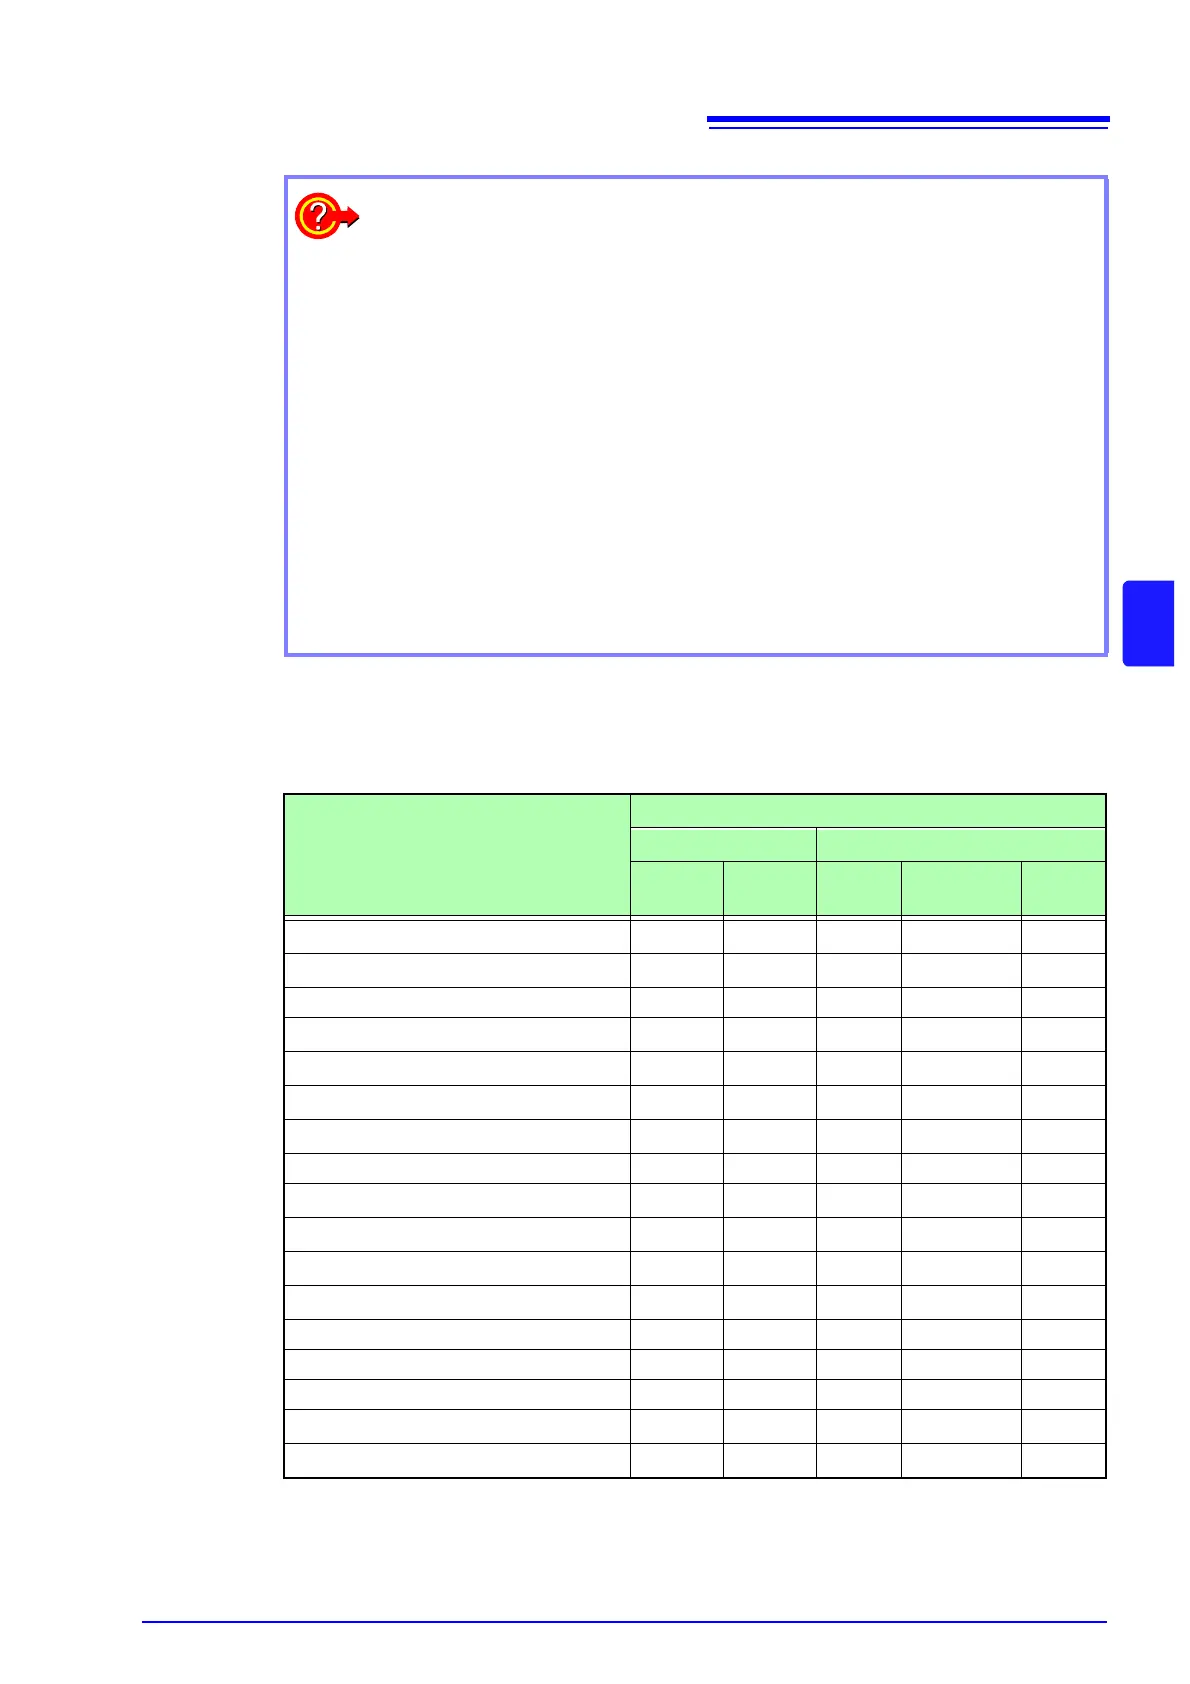
: Settable, ×: Cannot be set,
O
: Partially settable
Analysis Mode
Averaging
Waveform Averaging Spectrum Averaging
Simple
Exponen-
tial
Simple Exponential
Peak
Hold
OFF
×××××
Storage Waveform
×××
Histogram
×××
Linear Spectrum
O
*2
O
*2
O
*2
RMS Spectrum
O
*2
O
*2
O
*2
Power Spectrum
Power Spectrum Density *1
LPC analysis(Power Spectrum Density) *1
×××
Transfer Function
O
*2
O
*2
O
*2
Cross Power Spectrum
O
*2
O
*2
O
*2
Impulse Response
Coherence Function
×××
Phase Spectrum
×××
Auto-correlation Function
Cross-correlation Function
1/1 Octave Analysis *1
1/3 Octave Analysis *1
*1. Not available for external sampling
*2. Not available when the y axis is real (linear) or imaginary (linear), or for Nyquist plots
 Loading...