3.4 Setting Measurement Configuration
44
Description
Selecting the
time axis range
Refer to the table below when setting the time axis range.
For example, to measure a 100 kHz waveform, the maximum display frequency set-
ting range according to the table is 200 kHz - 800 kHz. If the maximum display fre-
quency is set to 400 kHz, setting the time axis range to 10 μs/div is recommended.
The sampling rate is automatically set to 1/100 of the selected time axis range.
Timebase Sampling Rate (Speed) Maximum display frequency
5 μs/div
10 μs/div
20 μs/div
50 μs/div
100 μs/div
200 μs/div
500 μs/div
1 ms/div
2 ms/div
5 ms/div
10 ms/div
20 ms/div
50 ms/div
100 ms/div
200 ms/div
500 ms/div
1 s/div
2 s/div
5 s/div
10 s/div
30 s/div
50 s/div
1 min/div
100 s/div
2 min/div
5 min/div
50 ns (20 MS/s)
100 ns (10 MS/s)
200 ns (5 MS/s)
500 ns (2 MS/s)
1 μs (1 MS/s)
2 μs (500 kS/s)
5 μs (200 kS/s)
10 μs (100 kS/s)
20 μs (50 kS/s)
50 μs (20 kS/s)
100 μs (10 kS/s)
200 μs (5 kS/s)
500 μs (2 kS/s)
1 ms (1 kS/s)
2 ms (500 S/s)
5 ms (200 S/s)
10 ms (100 S/s)
20 ms (50 S/s)
50 ms (20 S/s)
100 ms (10 S/s)
300 ms (3.33 S/s)
500 ms (2 S/s)
600 ms (1.67 S/s)
1 s (1 S/s)
1.2 s (0.83 S/s)
3 s (0.33 S/s)
800 kHz
400 kHz
200 kHz
80 kHz
40 kHz
20 kHz
8 kHz
4 kHz
2 kHz
800 Hz
400 Hz
200 Hz
80 Hz
40 Hz
20 Hz
8 Hz
4 Hz
2 Hz
0.8 Hz
0.4 Hz
0.13 Hz
0.08 Hz
0.04 Hz
0.067 Hz
0.033 Hz
0.013 Hz
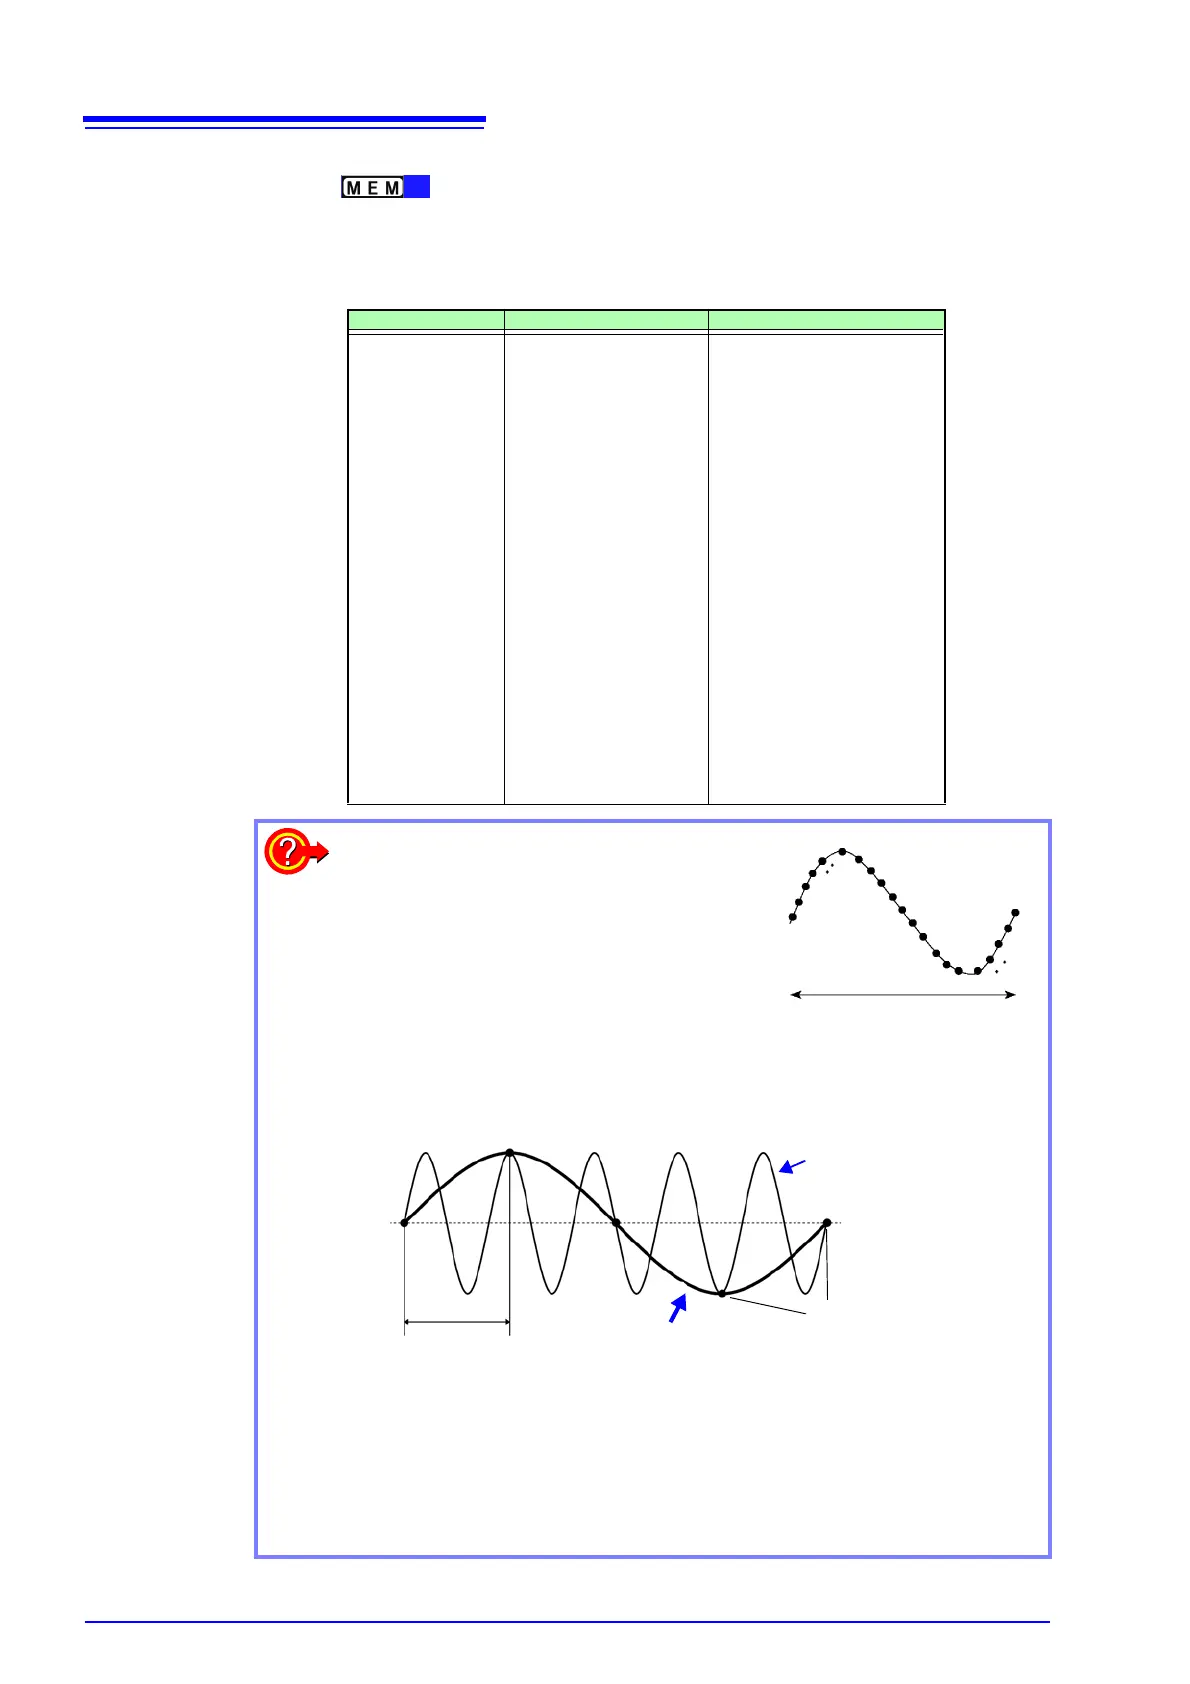
What is the maximum display frequency?
Displaying waveforms by their sampled values
with adequate resolution of characteristics such
as sine wave peaks requires a minimum of
about 25 samples per waveform period.
Maximum display frequency is determined by
the timebase.
What is aliasing (recording of non-existent waveforms)?
If the signal to be measured changes too fast relative to the sampling rate,
beginning at a certain frequency, non-existent slow signal fluctuations are
recorded. This phenomena is aliasing.
With the Memory function, the sampling rate can be significantly affected by the
timebase setting, so care is necessary to avoid aliasing when selecting the
timebase. Because the timebase determines the maximum display frequency,
the fastest possible timebase setting should be used.
When the signal can be recorded repeatedly, the auto-ranging function (
p.58) may be used to select the optimum timebase.
One Signal Period
1
2
3
23
24
25
Sampling Rate
Measured Waveform
Aliasing occurs when the sampling period is longer
than half of the input signal period.
Actual Input Signal
Sampling Points