13-18 824 Reference Manual 9/29/09
may have up to ±0.2dB variation compared to the FFT Flat
weighting (due to component variations and tolerance).
Flatness FFT Display
The Flatness FFT display can also
be accessed from the View Menu as
described in "View Menu" on page
13-5.
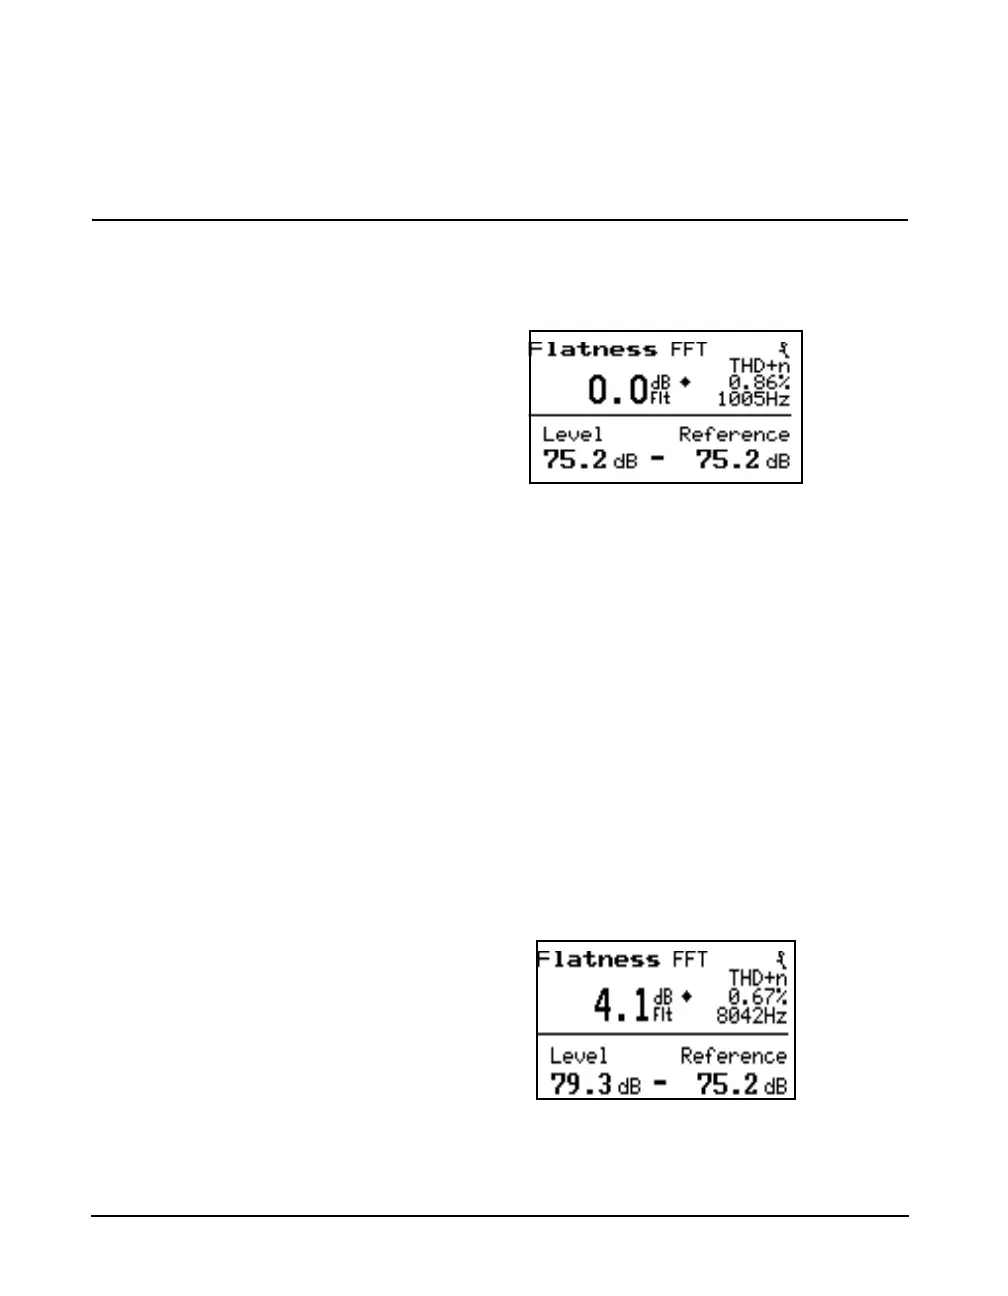
The Flatness FFT display, shown below, is can be accessed
from the Linearity FFT display by pressing the down arrow
key d.
The Flatness FFT display shows the relative level of the
highest FFT bin, the true frequency of the input signal
derived from the FFT data and the THD plus noise metric.
The frequency weighting for this display is forced to Flat
regardless of the Weighting setting.
This display is used to measure the frequency response of an
audiometer. The highest amplitude FFT bin is found and its
level is displayed in the lower left corner of the display. The
chosen reference level is displayed in the lower right corner.
A precise measurement of the frequency is displayed to the
center right of the display. If the level is greater than the
trigger level setting the THD plus noise value will be
displayed in the upper right corner.
The example display shown above is for a measurement at
1kHz. Measurements at 8kHz and 125Hz would appear as
shown below.