5-12 824 Reference Manual 9/29/09
to the appropriate position and the frequency readout
changes accordingly.
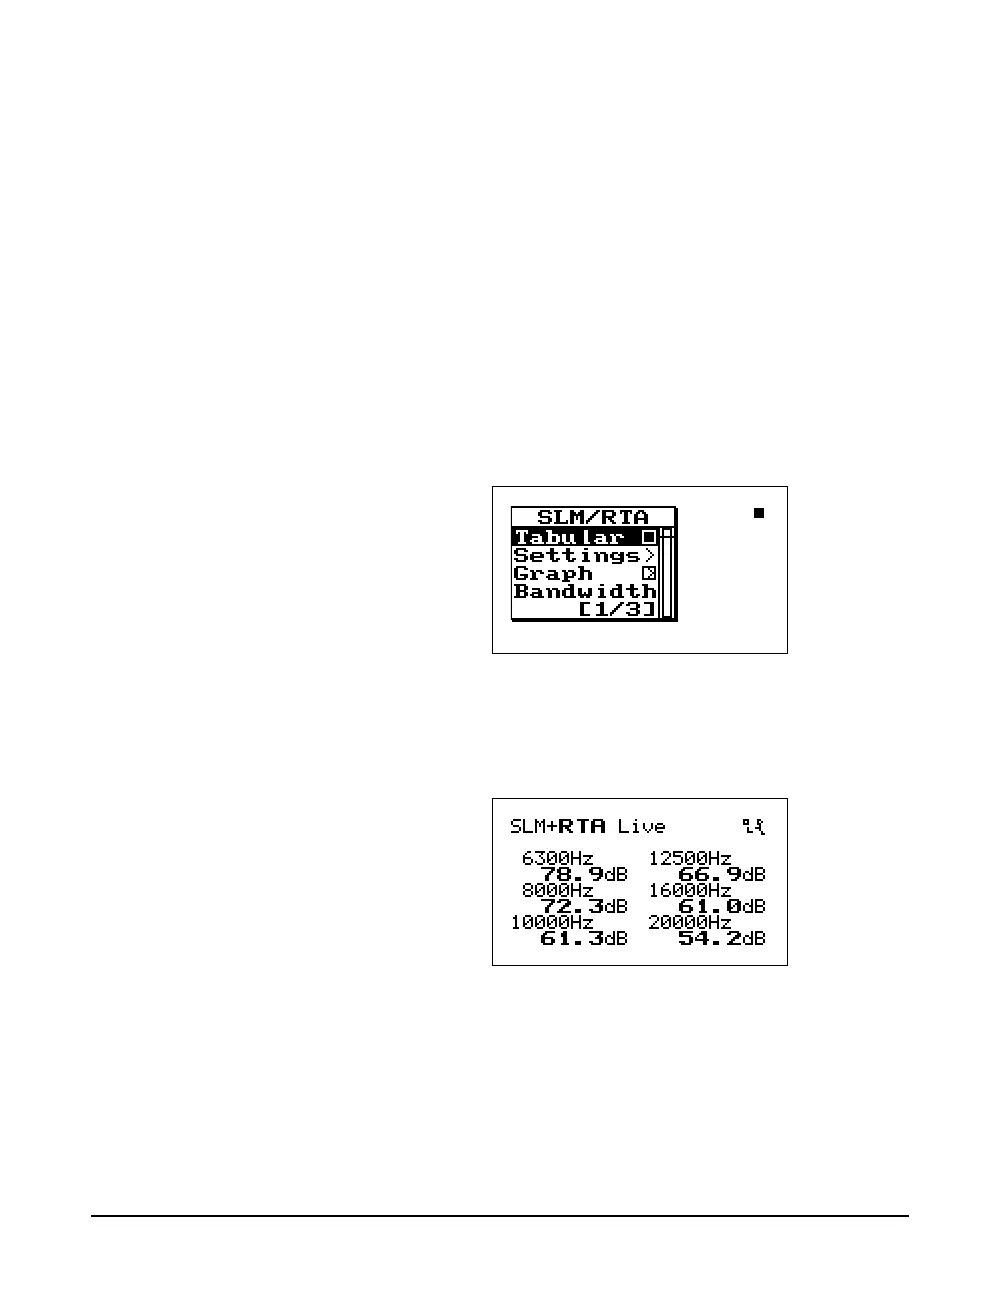
Tabular SSA Views
The Tabular display can also be
accessed from the main View menu
by highlighting the desired RTA view,
pressing the
r arrow key, and
then selecting Tabular from the
submenu that appears.
In addition to a graphical view, a tabular display is also
available for the RTA Live, RTA Leq, or RTA Max modes
which shows a tabular listing of the dB readings at specified
frequency levels in each of these spectra. To access the
tabular displays do the following:
Step 1 Press the
c Check key while in the RTA Live,
RTA Leq, or RTA Max graphical views. The fol-
lowing menu appears:
While in the main tabular view, the
uandd arrows keys cycle you
through the different spectra’s (i.e.
RTA Live, RTA Max, and RTA L
eq
)
tabular displays.
Step 2 Highlight Tabul a r using the
u or d arrow
keys then press the
c check key. A tabular dis-
play like the following screen appears:
Step 3 To return to the graphical view, press the
c
check key and the following menu appears:
Therand larrow keys move
you through a series of tabular
displays showing the current
spectra’s dB readings at each center
frequency.