9/29/09 System 824 Views 5-11
SSA Displays
All of the following views can be accessed through the V
View key when using the SSA instrument.
Additionally, the RTA Live, RTA L
eq
, RTA Max and RTA
Min can be easily switched between each other by using the
uordto move to any of the other views.
The
rorlarrow keys can used to move the cursor.
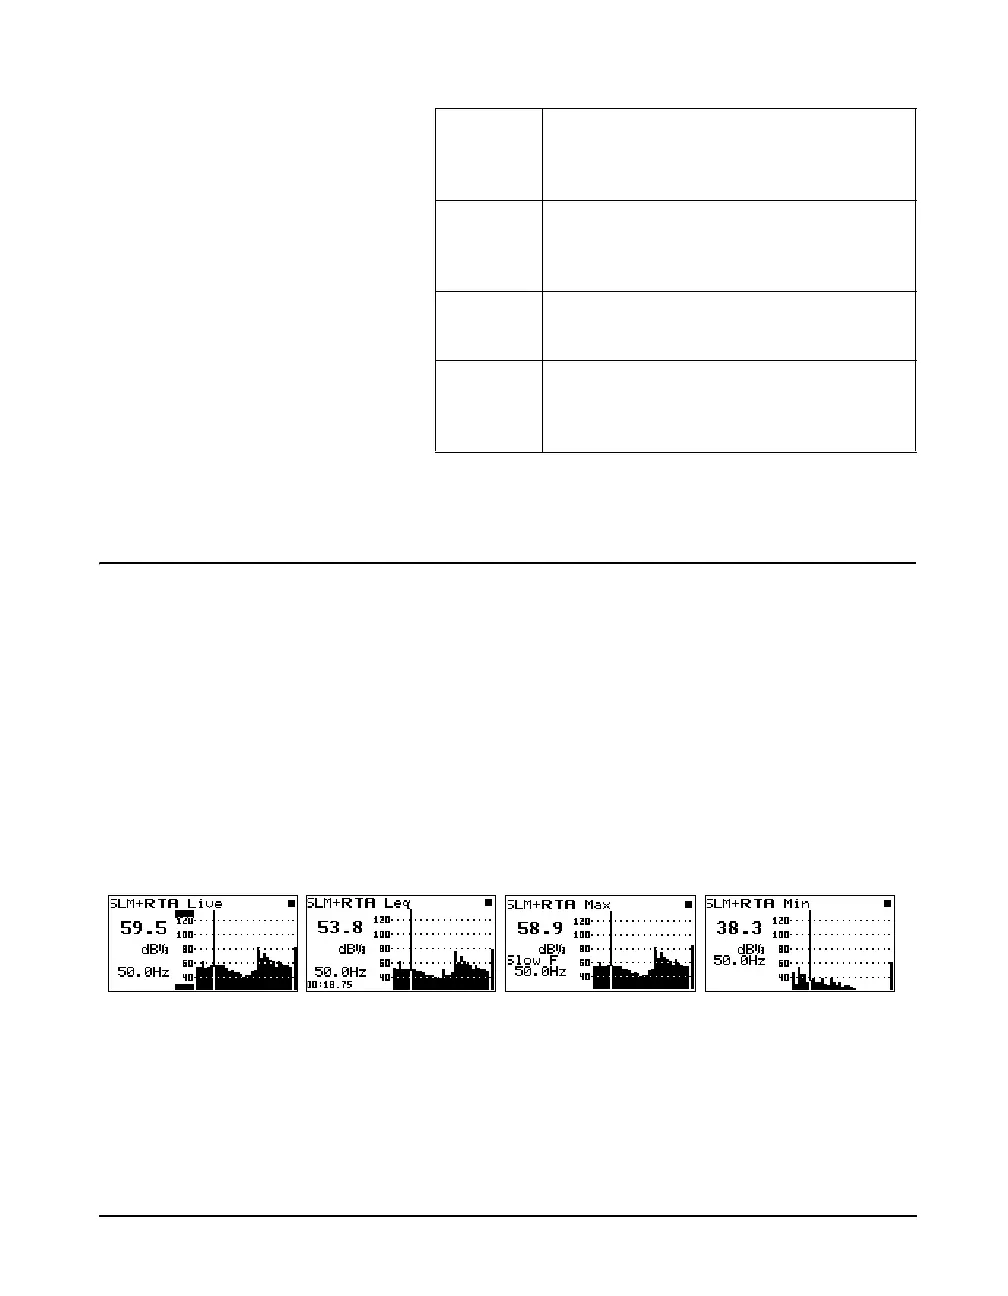
SSA Displays Including 1/1 or
1/3 Octave Spectral Data
The following are examples of the graphical displays for the
RTA Live, RTA Leq, RTA Max, and RTA Min.
In the above views the cursor position (the vertical bar in the
graph) corresponds to the level and frequency values shown.
the left side of the display. The cursor or (frequency bar
position) can be changed by pressing the
rorlarrow
keys. As the arrow keys are pressed, the vertical bar moves
SLM
Time
History
Shows the Leq for each time history period
in graphical form plus the selected
advanced T.H. items.
RTA Time
History
Live/Leq
Shows the spectral data for each time
history period.
Run Log Displays the start and stop times/dates of
the active measurement
Ln
Centiles
Ln percentile levels exceeded ‘n’ percent of
the measurement time for broadband and
spectral data.