5-10 824 Reference Manual 9/29/09
available in the SSA instrument; the RTA Live
(instantaneous) spectrum, the RTA Leq or time weighted
averaged (since last reset) spectrum, RTA Max spectrum,
which is the spectrum time coincident with the maximum
value of the SPL during the measurement interval and RTA
Min, which shows the minimum level obtained by each
filter during the measurement interval. There are also
displays for the Interval History, the Time History, the Run
Log and for Ln Centiles.
Like all of the System 824 displays, these views are
accessed via the
V View key as described earlier in the
“General Views” section of this chapter.
The following briefly describes the main views available to
the SSA instrument.
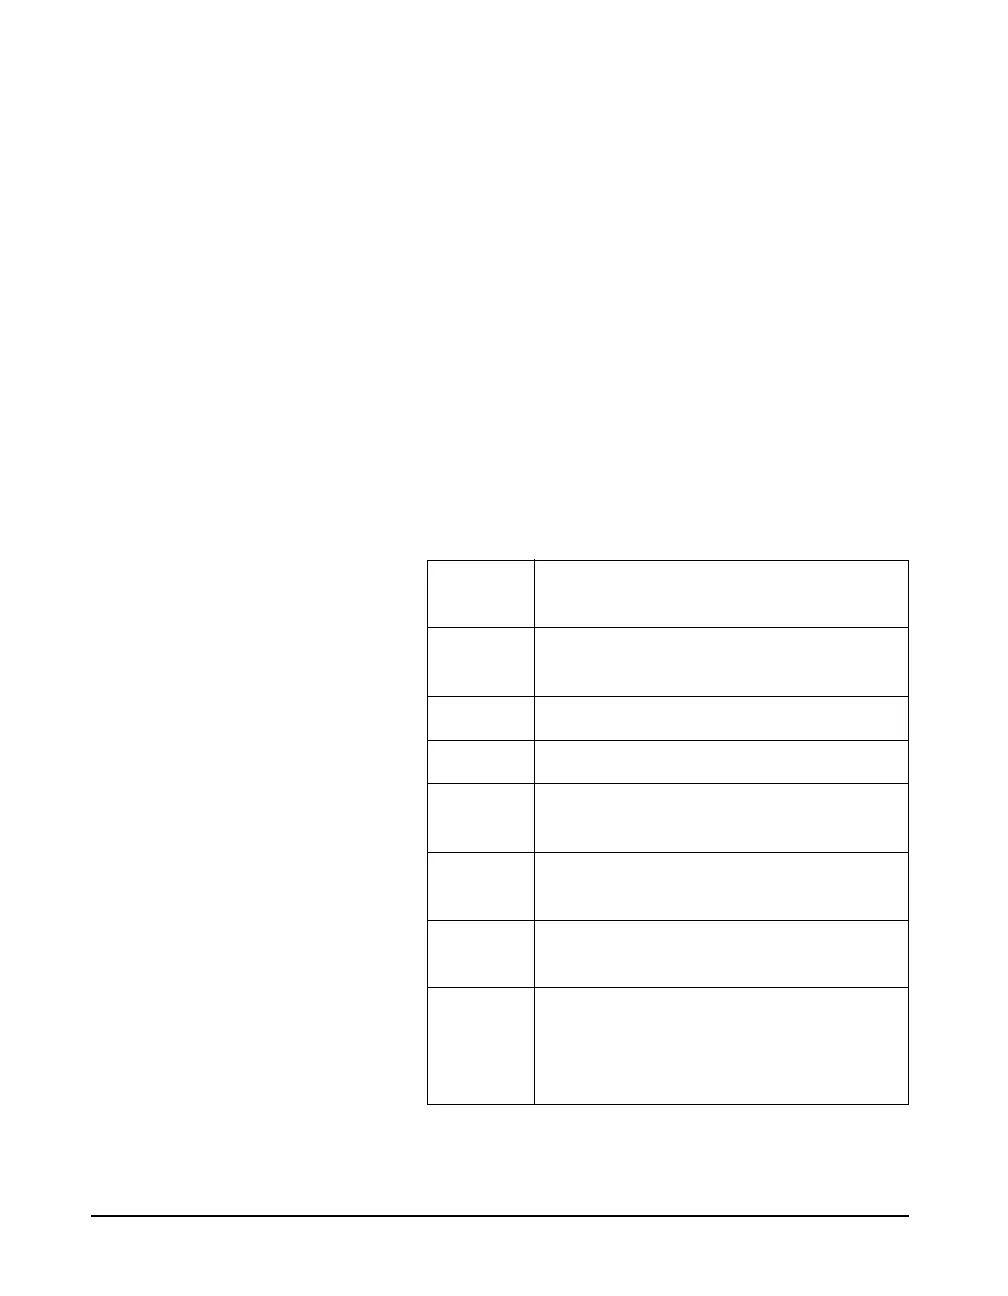
Menu
Items
Purpose
SLM SLM data with graphic display of Time
History.
Any Data Tabular display of SLM data
RTA Live Real-time frequency analysis display
RTA Leq Leq frequency analysis display since the
last reset
RTA Max Frequency spectrum associated with the
highest SPL RMS level since the last reset
RTA Min The minimum level recorded for each
frequency during the measurement.
Intervals Shows an Leq spectrum, Max or Min
spectral data, a broadband Leq, Lmax,
Lmin, SEL, Lpeak and Spectral Lns for
each interval period.
To store interval spectral Ln
levels, set “Spectral Ln” to
“Interval”, enable Ln and
Interval histories and set “Intv
Save Ln” to “Yes”.