9/29/09 RTA (optional) 11-33
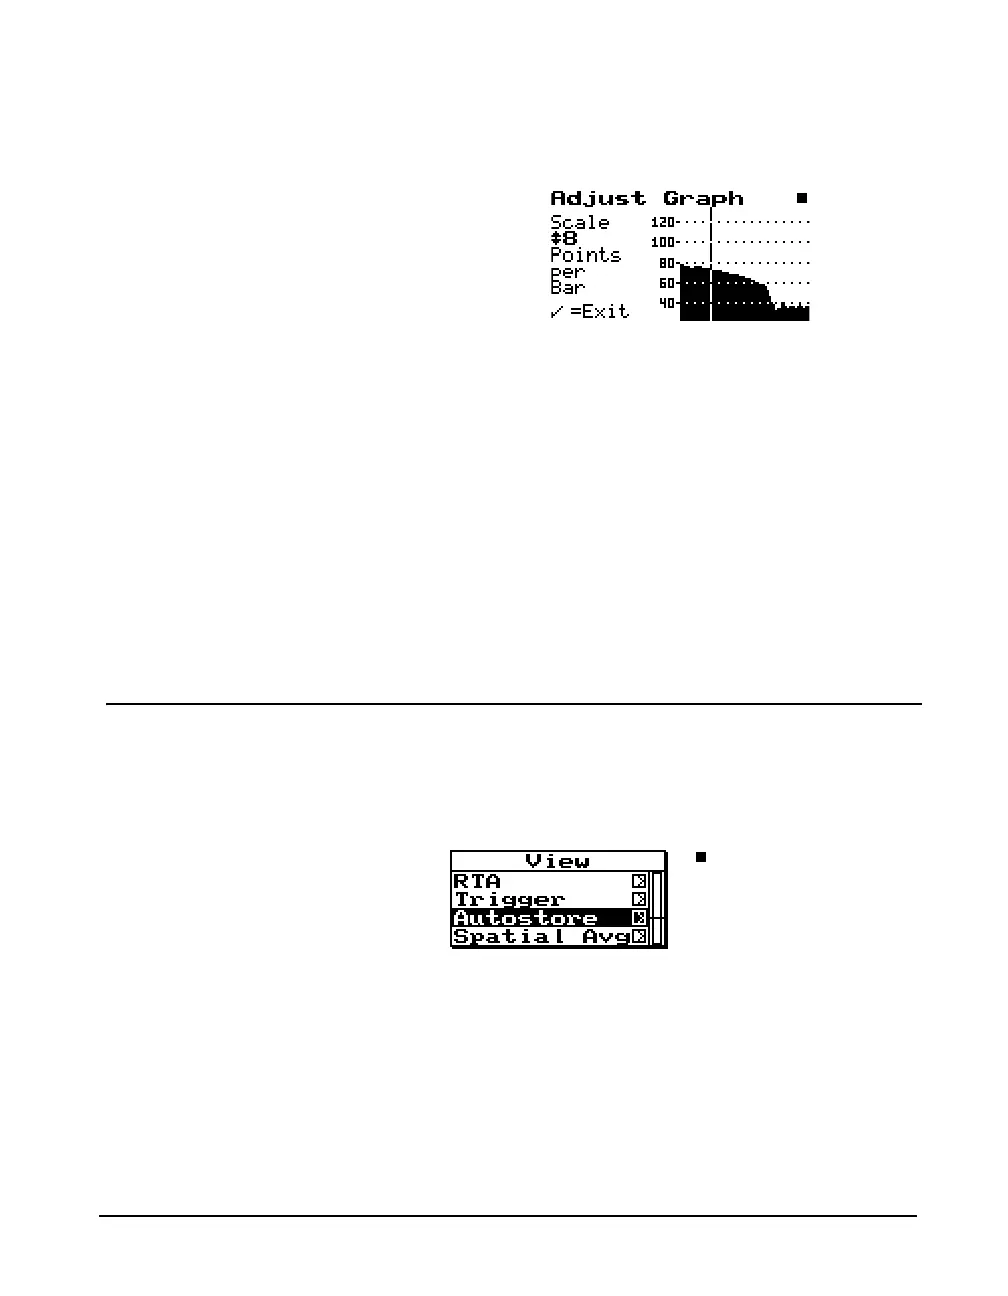
• Graph-H - Adjusts the horizontal graph scale
Press the
uup and ddown arrow keys to
adjust the horizontal scale factor.
Press the
c check key to exit.
RT-60
The RT-60 display is accessed by pressing the V View key
and highlighting “Autostore”. The menu appears like this:
Press the
rright arrow key to bring up the “View
Autostore” display view menu.
The horizontal graph adjustment,
(Graph-H), provides a useful
feature that allows you to view a
large amount of time data in the
ByTime Graph view. A scale
factor of 1 to 1024 can be
selected. A scale factor of greater
then 1 will cause multiple pieces
of time data to be graphed to 1
bar. The measured data can be
viewed by pressing the
lleft or
rright arrow keys. The cursor
will not move to the next graph
point until the selected number of
data points have been displayed
numerically. This facility allows
up to 1024 numeric data points to
be displayed for each graph
cursor point and allows the user
to observe an overall shape of the
measured data on screen without
the need for scrolling.