Measurements and Results
R&S
®
FSW
147User Manual 1173.9411.02 ─ 43
same frequency. Smooth operation is ensured only if all users adhere exactly to their
assigned timeslots.
Both the power during the send phase as well as the timing and duration of the TDMA
burst, and rise and fall times of the burst, are important.
● Measuring the Power Characteristic of Burst Signals...........................................147
● Measuring the Signal-to-Noise Ratio of Burst Signals.......................................... 150
7.1.6.1 Measuring the Power Characteristic of Burst Signals
To measure power in zero span, the R&S FSW offers easy-to-use functions that mea-
sure the power over a predefined time.
Measuring the Power of a GSM Burst During the Activation Phase
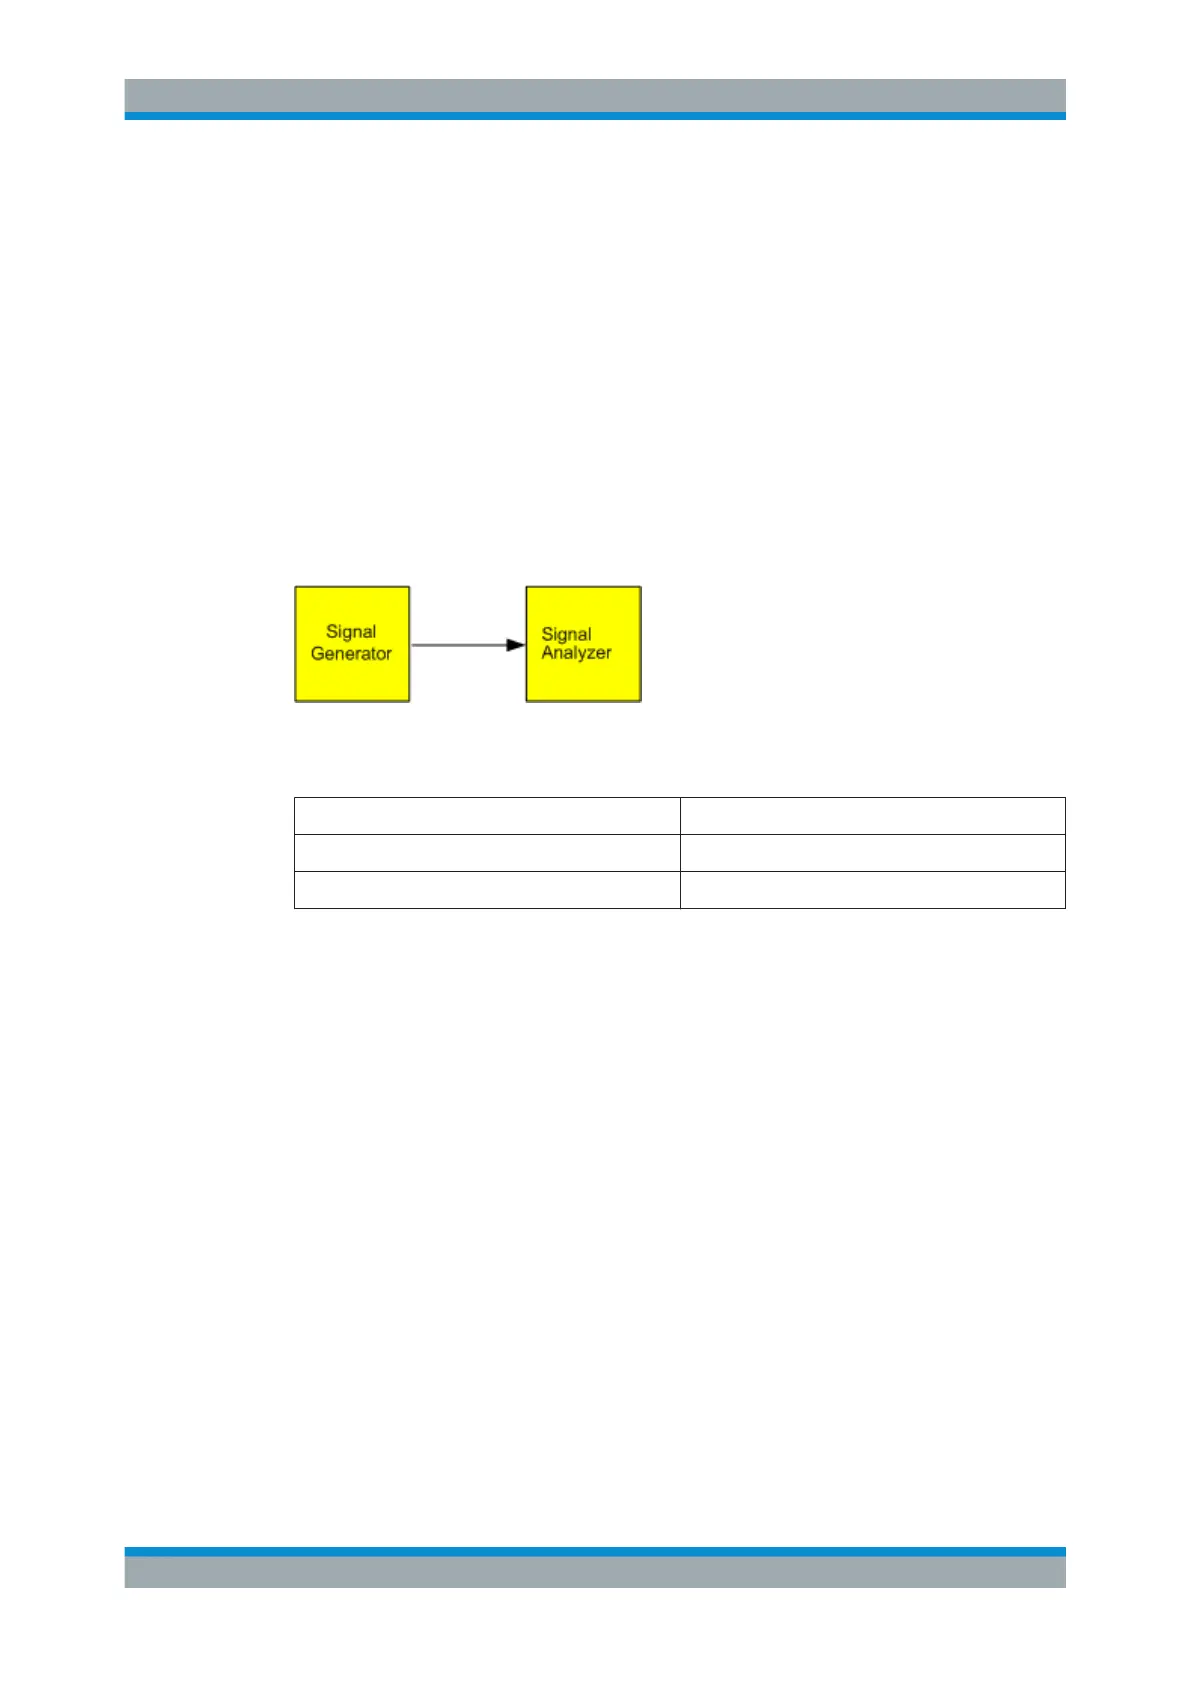
Figure 7-13: Test setup
Table 7-6: Signal generator settings (e.g. R&S SMW)
Frequency 890 MHz
Level 0 dBm
Modulation GSM, one timeslot activated
1. Select [PRESET] to reset the instrument.
2. Set the center frequency to 890
MHz ([FREQ]).
3. Set the frequency span to 0
Hz ([SPAN] > "Zero Span").
4. Set the reference level to 10
dBm (= level of the signal generator +10 dB) (AMPT).
5. Set the attenuation to 20
dB ([AMPT] > "RF Atten Manual").
6. Set the resolution bandwidth to 1
MHz ([BW] > "Res BW").
7. Set the sweep time to 1
ms ([SWEEP] > "Sweep Time Manual").
The R&S FSW shows the GSM burst continuously across the display.
8. Using the video trigger, set triggering on the rising edge of the burst.
a) Press the [TRIG] key.
b) Set the "Trg Source" to "Video".
c) Set the "Trg/Gate Level" to 70%.
The R&S FSW shows a static image with the GSM burst at the start of the trace.
The trigger level is displayed as a horizontal line labeled with the absolute level for
the trigger threshold in the measurement diagram.
Basic Measurements

 Loading...


