Common Analysis and Display Functions
R&S
®
FSW
582User Manual 1173.9411.02 ─ 43
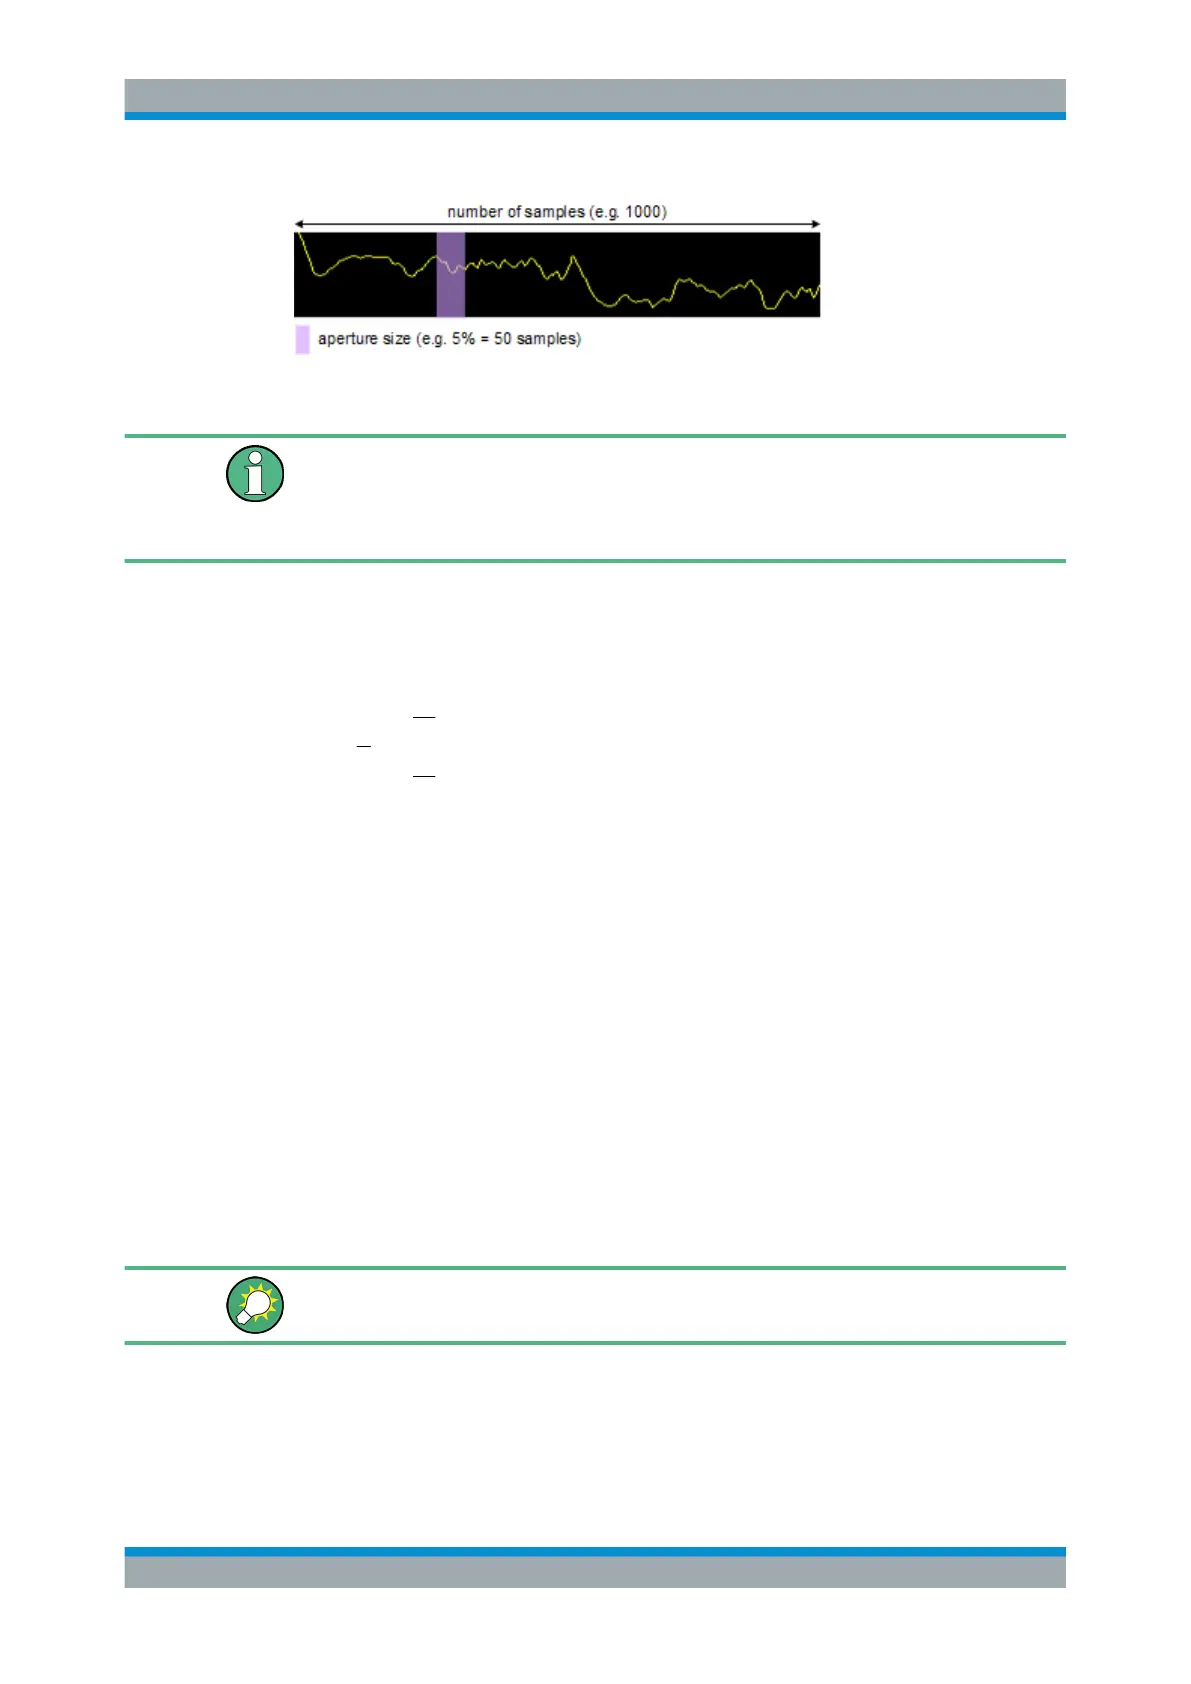
Figure 9-13: Sample size included in trace smoothing
Effects of smoothing on post-processing functions
Note that in Spectrum mode, all functions performed after the sweep, such as limit
checks, markers, or channel power measurements, are based on the smoothed trace
data. Thus, the results differ from results based on the original trace.
You can turn trace smoothing on and off for all traces individually and compare, for
example, the raw and the smooth trace.
Linear smoothing is based on the following algorithm:
2
1
2
1
1
'
n
sx
n
sx
xy
n
sy
Equation 9-1: Linear trace smoothing
With:
s = sample number
x = sample offset from s
n = aperture size
9.5.1.2 Trace Settings
Access: "Overview" > "Analysis" > "Traces"
Or: [TRACE] > "Trace Config"
You can configure the settings for up to 6 individual traces.
For settings on spectrograms, see Chapter 9.5.2.2, "Spectrogram Settings",
on page 597.
Trace data can also be exported to an ASCII file for further analysis. For details see
Chapter 9.6.2, "Trace/Data Ex/Import", on page 610.
Trace Configuration

 Loading...


