Using the Review Workspace 333
The examples below show the same data displayed in different data
views.
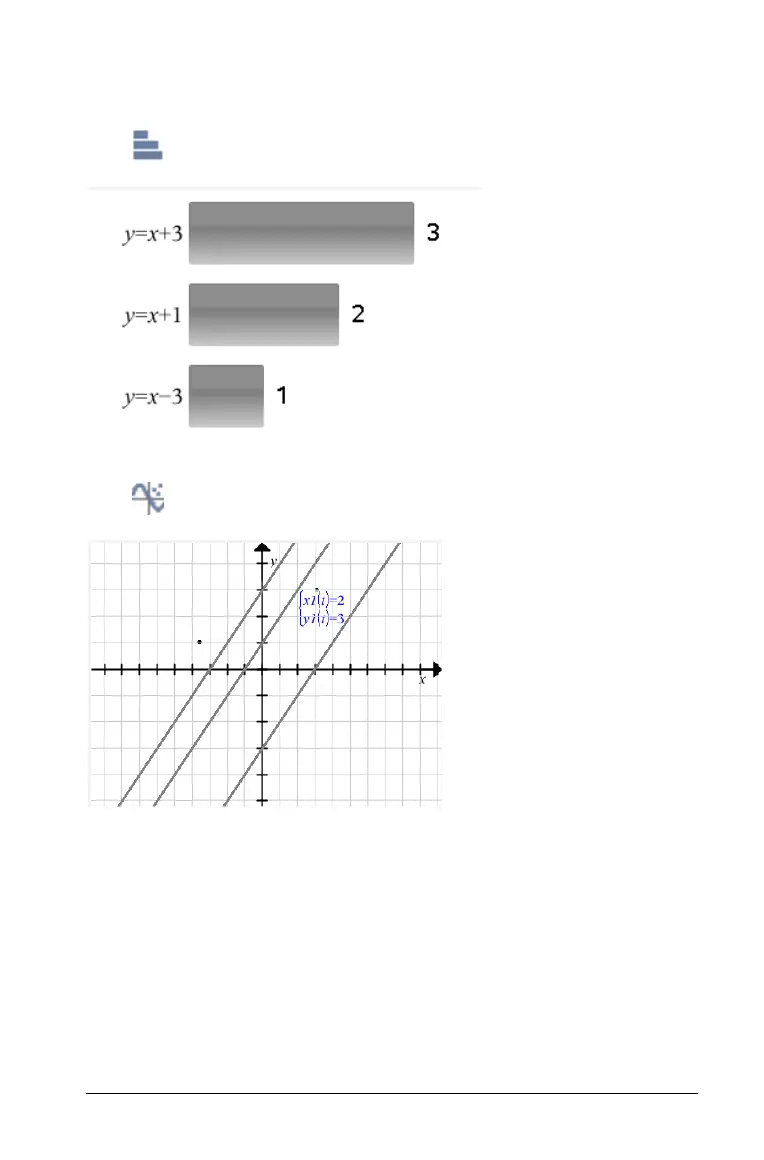
Click to view the data in bar chart form.
Click to view the data in graph form.
When you are in graph view, the Graph Tools are available to allow you
to work with the graph.
In the bar chart and graph views, you can let your mouse pointer hover
over a response to see a list of students who gave that response.

 Loading...


