Using Data & Statistics 621
Alternatively, you can drag a selection rectangle around the points to
select them.
2. Drag any of the selected points to move them all.
Note: When a list is defined in Lists & Spreadsheet as a formula, the
movement of points is restricted to positions that satisfy the formula.
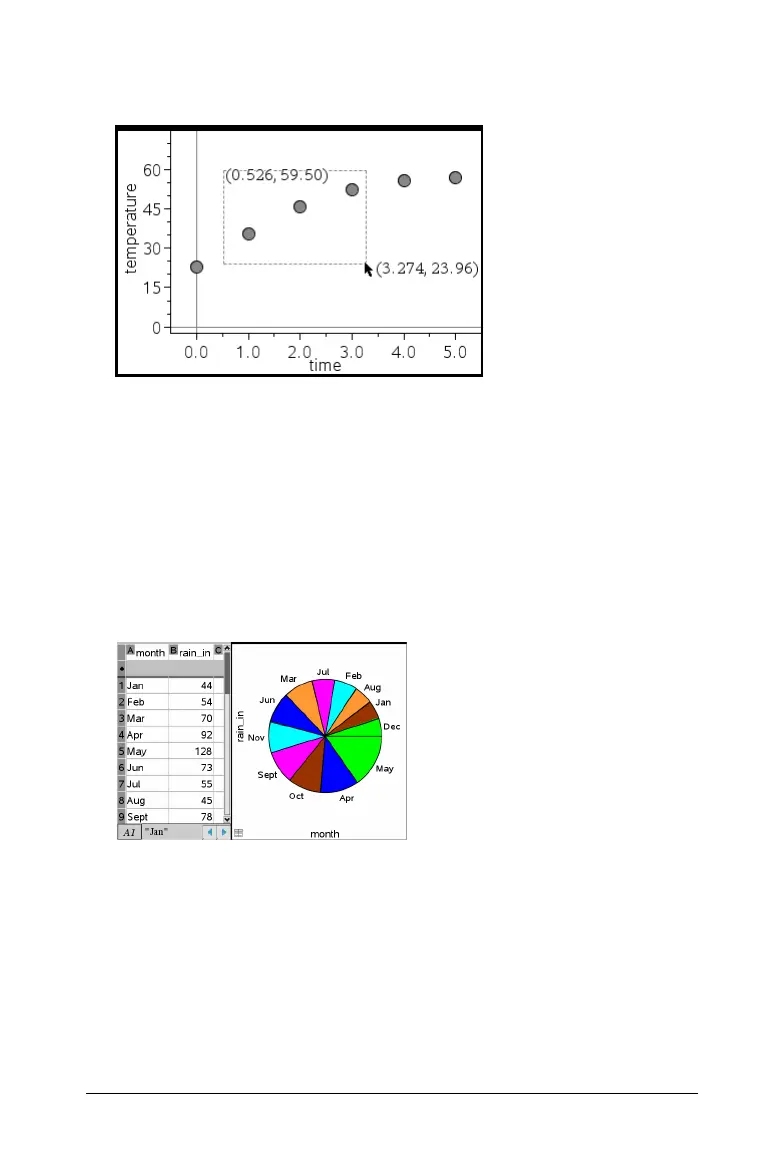
Sorting plotted categories
You can sort plotted categories in list order, value order, or alphabetically
by category name.
1. Click the work area that contains the plotted data.
2. On the Actions menu, select Sort, and select the type of sort.
Note: You can customize the order of the categories by clicking a label
and dragging it.
Plotting a value
You can plot a value on an existing plot. It displays as a vertical line in the
work area.
1. From the
Analyze menu, select Plot Value.
Months listed chronologically but plotted by value
(amount of rain)

 Loading...


