Using the Review Workspace 339
Organizing responses
You can configure a plot list for List questions, organize bar chart data
and table views, individualize student responses, and organize Multiple
Choice questions that have multiple responses into separate, group, or
equivalent responses.
Configuring a plot list
The plot list settings let you set different shapes for the different plots
that can help you follow separate lines or responses on a graph.
To set the plot list settings, follow these steps.
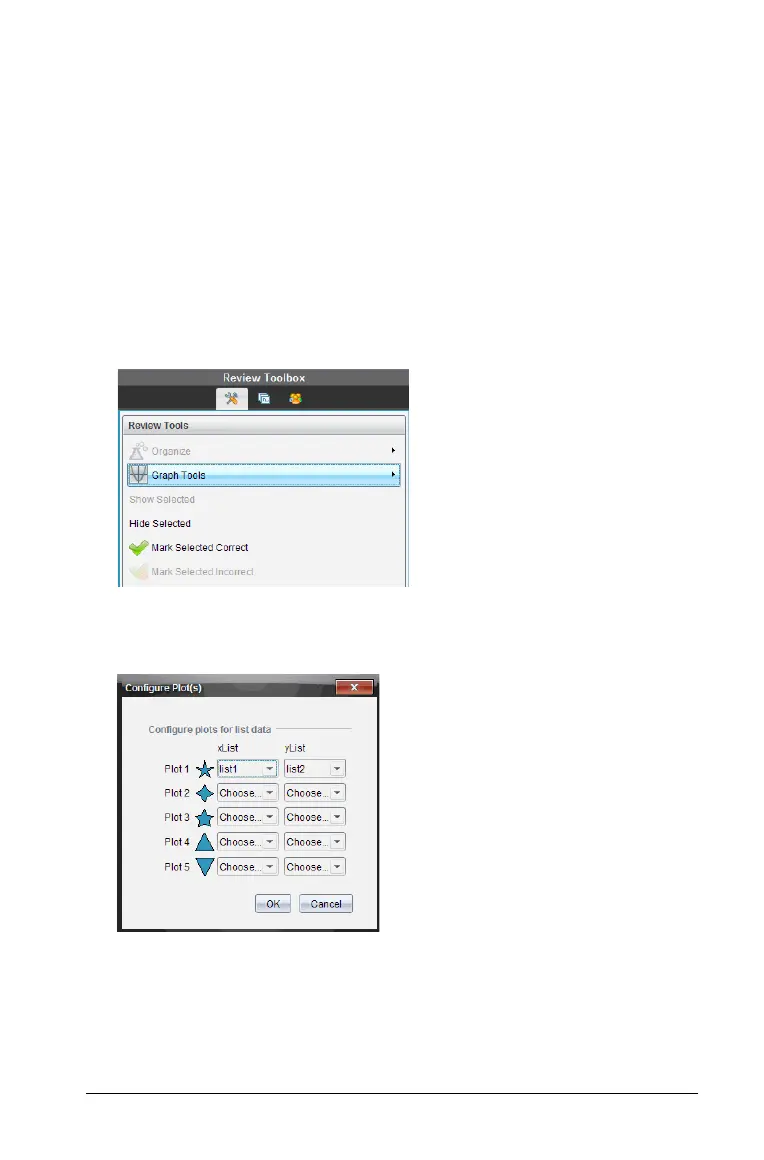
1. While in graph view, Click
Graph Tools in the Review toolbox.
2. Select Plot List Settings.
The Configure Plot(s) dialog box displays.
3. Choose which shape you want to represent the xList and yList, and
click the down arrow next to that shape to choose which list to
represent (list1, list 2, and so forth).
Note: You can choose more than one shape for each list.
4. Click
OK.

 Loading...


