460 Graphs & Geometry
In this case, a rectangle is created with the desired perimeter, and
then both the perimeter and area values are displayed. The perimeter
value is locked. As you manipulate the rectangle, the perimeter
remains unchanged but the area changes. When the optimum area
displays, you can measure the sides to obtain the necessary
dimensions.
Graphs & Geometry views
The Graphs & Geometry application has three separate views. Each is
tailored to specific types of explorations:
•In
Graphing view, the work area contains axes for graphing 2D
functions. The view includes an entry line where you can type and
edit the expressions to be graphed.
•In Plane Geometry view, you can explore geometric objects. You can
optionally use the Plane Geometry view in modeling mode (that is,
Plane Geometry view with an analytic window added for working
with objects in an axis system).
•In
3D Graphing view, the menu and work area change to let you
graph and explore 3D functions of the form z(x,y). The section
“Graphing 3D functions” in this chapter discusses 3D features.
When you add a new document, problem, or page, you can choose
Graphs or Geometry separately. The software adds a
Graphs & Geometry application in the selected view.
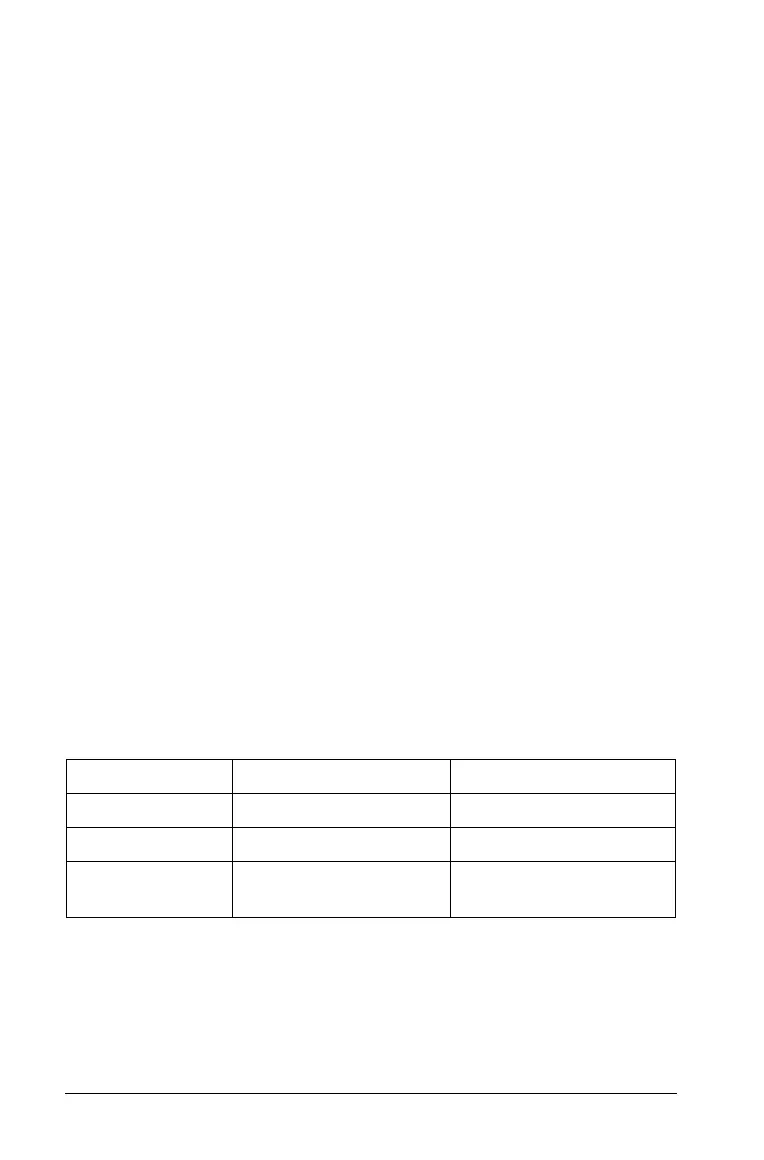
Summary of view differences
The following table describes some work area differences between the
Plane Geometry view and the Graphing View.
Feature Graph Area Plane Geometry Area
Aspect Ratio Adjustable; initially 1:1 Always 1:1 (static)
Units of Measure Generic (displayed as u) User-defined (per scale)
Area Graph Type Cartesian (default) or
Polar
Euclidian
 Loading...


