Using the Review Workspace 351
Adding teacher data
There may be times you want to add your own data to a graph you are
reviewing in class. The Graph Tools allow you to add teacher points and
teacher equations to a graph, and to set the plot list settings and
individualize the student responses.
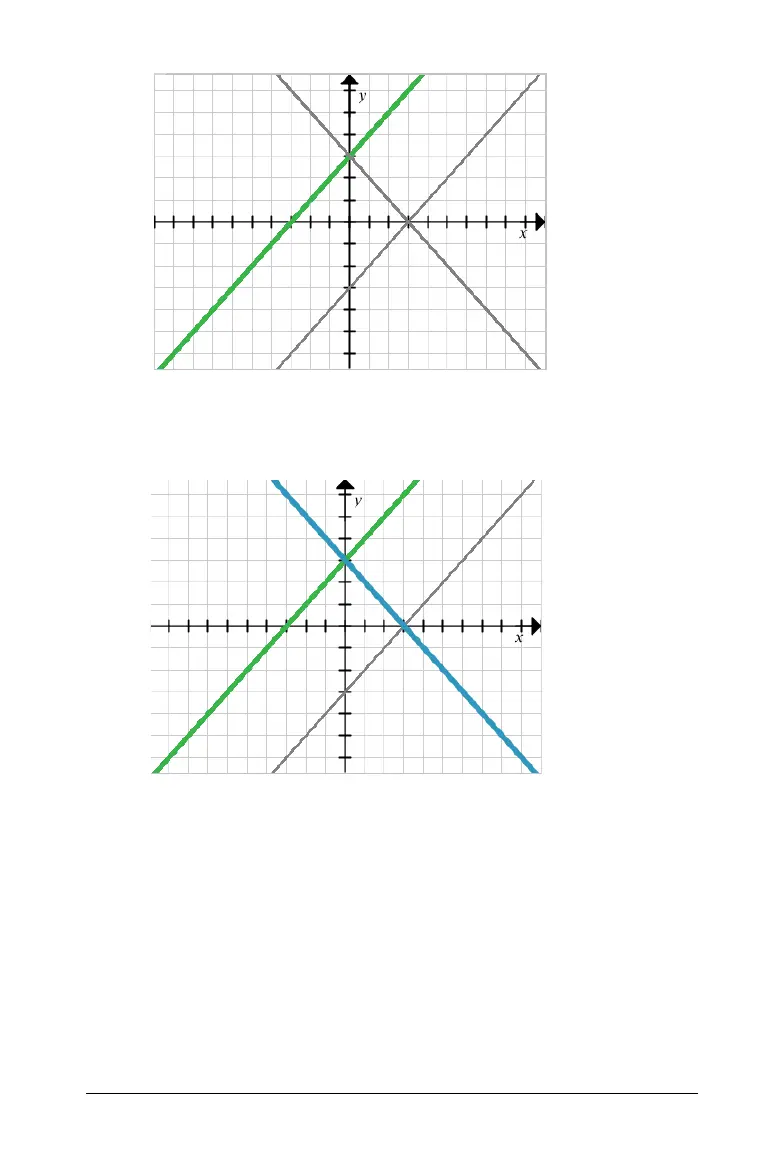
Teacher data is displayed larger than the students’ data, and in a
different color.
Graph view, Equation y= question with one correct answer, and
no student selected in the Student pane.
Graph view, Equation y= question with one correct answer,
and one student selected in the Student pane.

 Loading...


