Data Collection and Analysis 787
Examining graphs using Page Layout
You can use the Page layout functionality when Show Graph is not the
appropriate solution for showing more than one graph.
The Show Graph option is not applicable when:
• You have multiple runs using a singe sensor.
• When using two or more of the same sensors.
• When you have multiple sensors that use the same column(s) of data.
In these situations the Page Layout functionality is useful.
Note: See the chapter, Using multiple applications on a page, for more
information about Page Layout.
To use Page Layout:
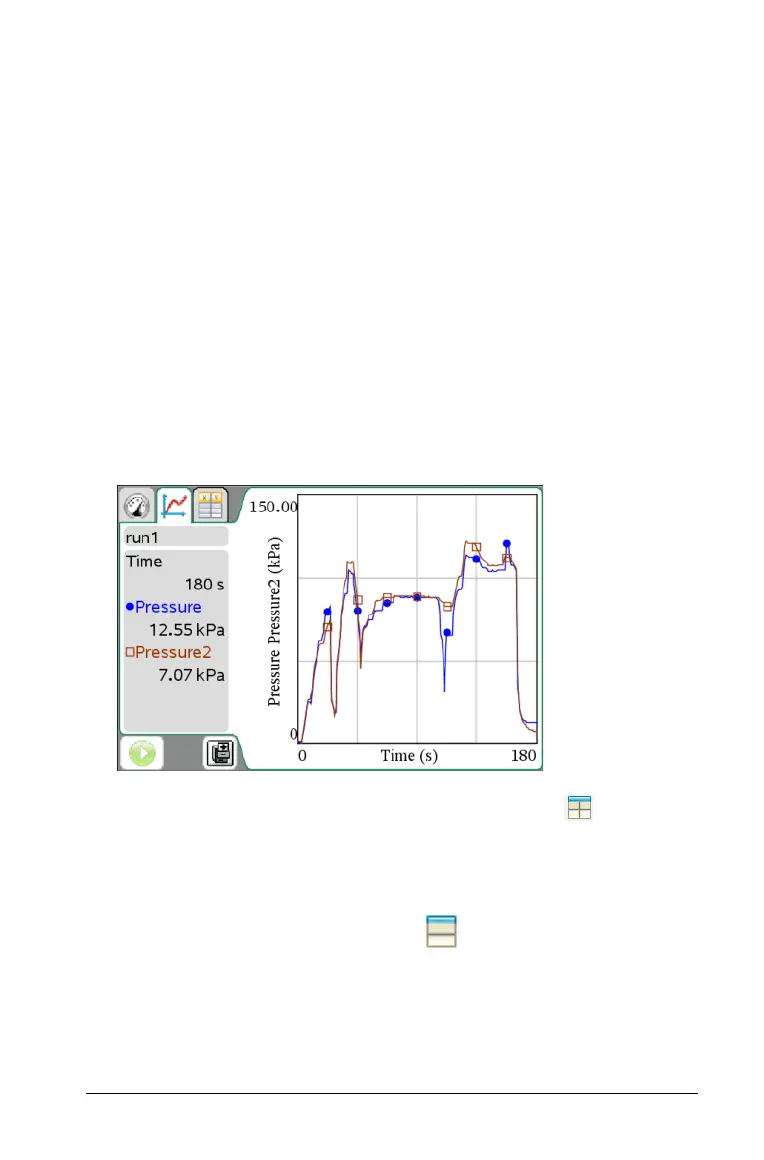
1. Open the original data set you want to see in two graph windows.
In this example, the data set is using two of the same sensors.
2. Select
Edit > Page Layout > Selected Layout or click .
Handheld: Press ~ and select Page Layout > Select Layout.
3. Select the type of page layout you would like.
In this example, the top and bottom page symbol was selected.

 Loading...


