564 Using Lists & Spreadsheet
5. If necessary, use e and the arrow keys to select the correct lists for
X List and Summary List.
6. In the Display On field, select how to display the summary plot in the
Data & Statistics application.
• Select Split Page to place the chart on half of the current page.
• Select New Page to add the chart on a new page.
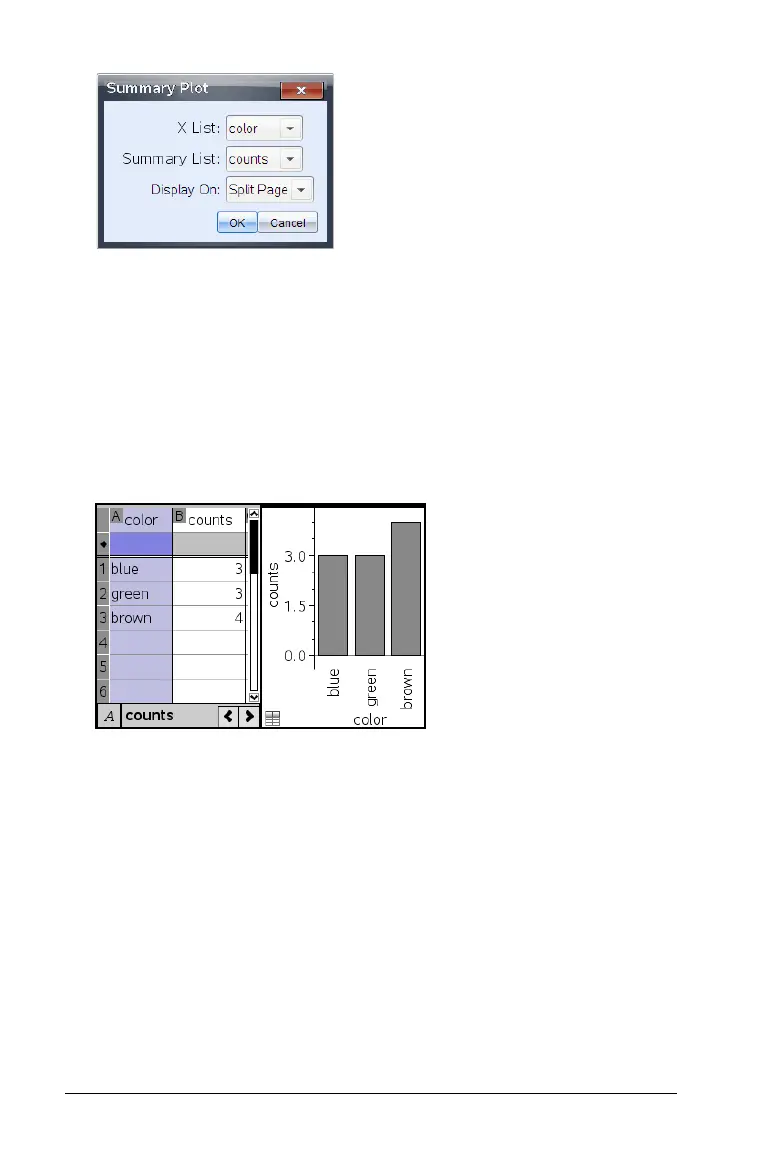
The summary plot displays with the list names along the axes and a
summary plot symbol in the lower left corner of the chart window.
Note: In this example, the X List contains string data, so the summary
plot displays as a bar chart. The category strings from the list display
beneath the bars.
Exchanging data with other computer software
You can use the TI-Nspire™ desktop software to copy table data to and
from software outside the TI-Nspire™ applications, such as TI DataEditor
(in the TI Connect™ software) and Excel® spreadsheet software.
For example, you can copy:
• The values of individual cells, a range of cells, or an entire list from
TI DataEditor.

 Loading...


