710 Data Collection and Analysis
Selecting views
In the Vernier DataQuest™ application, you can choose from three views:
• Meter
•Graph
•Table
The Vernier DataQuest™ application view tabs.
You can switch from one view to another at any time.
Selecting Meter View
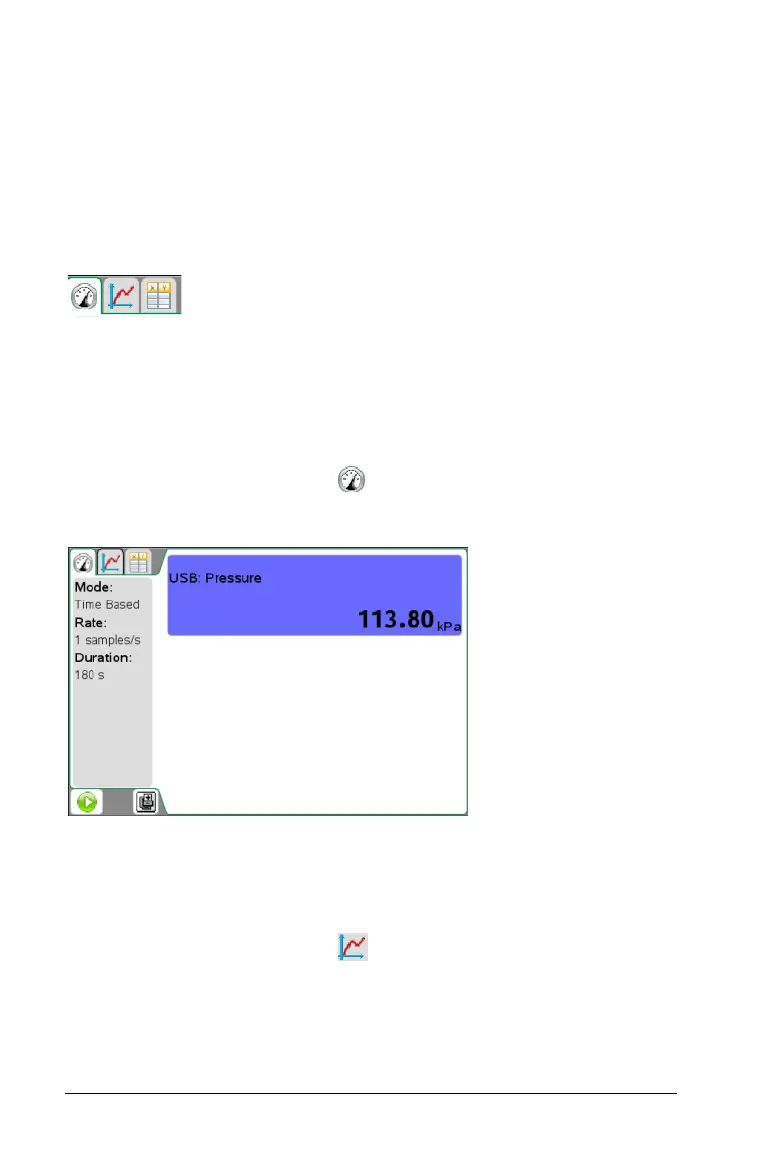
When you first open the application, Vernier DataQuest™ is in Meter
View. If one or more sensors are attached, a meter is displayed for each.
³ Select View > Meter or click .
The Meter View displays.
Selecting Graph View
The Graph view is where you can visualize your data and use analysis
tools.
³ Select View > Graph or click .
The Graph View window is displayed.