Data Collection and Analysis 709
Understanding the Application screen sections
The Vernier DataQuest™ application screen is identical for the computer
and handheld. The following is a general examination of the sections of
the application screen.
À
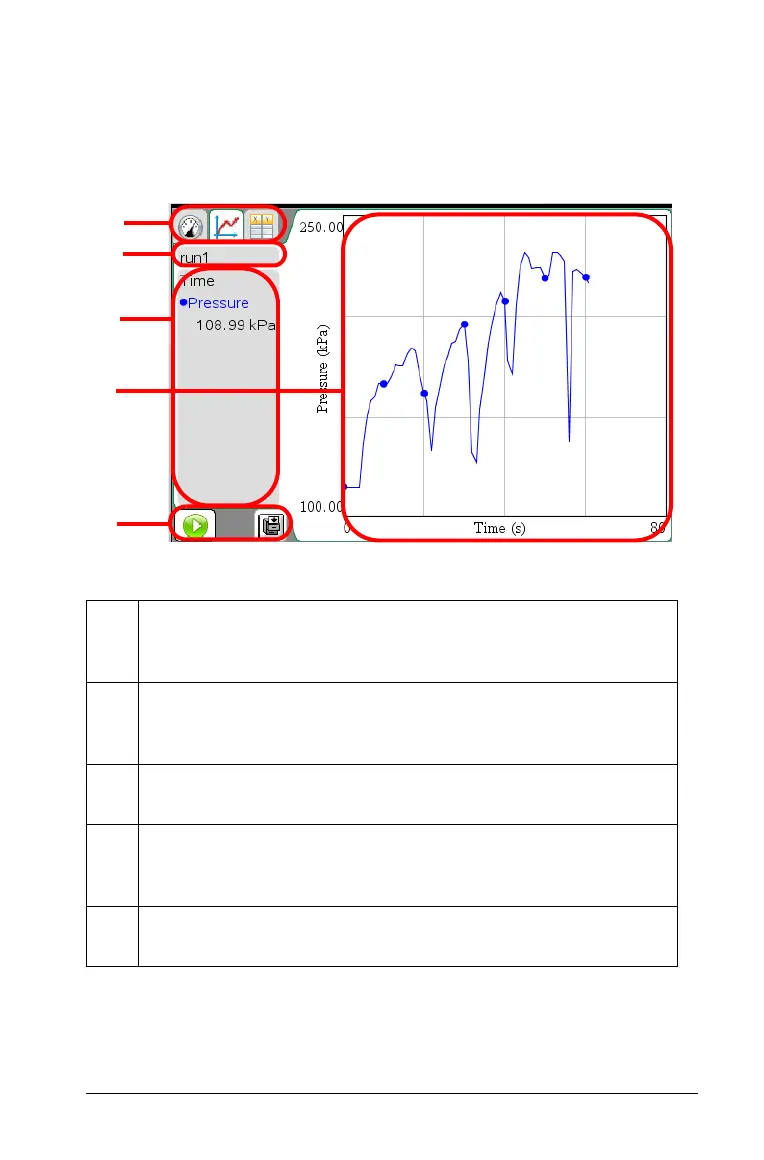
Vernier DataQuest™ application view tabs - There are
three selectable views: Meter, Graph, and Table. In this
example the Graph View is displayed.
Á
Data Set selection tool - This tool displays in the Graph
View only. This tool allows you to choose which data set is
graphed.
Â
View Details area - This area contains information about
the data appropriate for the current view.
Ã
Data display area -The primary display of the data. The type
of data displayed depends on the view. Examples of each
view will be covered later in this document.
Ä
Data collection controls - Use these buttons to start and
stop collections, store data sets, and capture data points.
À
Á
Â
Ã
Ä

 Loading...


