Data Collection and Analysis 753
• Do Not Autoscale - The graph window settings are not changed.
Using zoom in and zoom out
You can zoom in to a subset of the collected points. You can also zoom
out from a previous zoom or to expand the graph window beyond the
data points collected.
Zoom In
1. Select the area range you want to zoom in or use your current view.
See Selecting a range for instructions on how to select a range.
2. Select Graph > Zoom In or open the context menu on the graph and
select Windows/Zoom > Zoom In.
The graph window is now adjusted to only display your selected area.
The selected x range will be used as the new x range. The y range will
autoscale to show all graphed data points in the selected range.
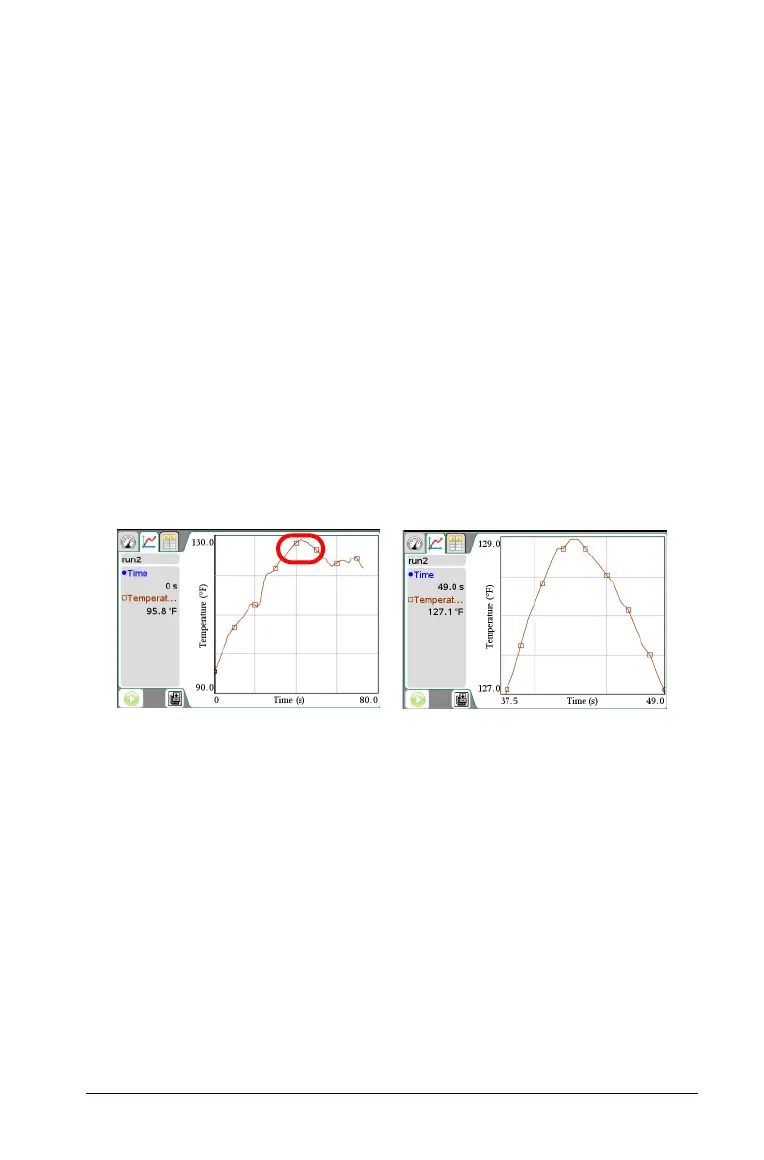
The following images show an original (autoscale) view and zoom in
performed multiple times (or as a selected region).
Zoom Out
1. Select Graph > Zoom Out or open the context menu on the graph
and select Windows/Zoom > Zoom Out.
The graph window is now expanded.
If a zoom in preceded a zoom out, it will return the settings prior to
the zoom in.
For example, if you zoomed in twice the first zoom out would return
the window to the state of the first zoom in. To get back to the full
graph (showing all data points) quickly from multiple zoom ins, use
Autoscale Now.

 Loading...


