Graphs & Geometry 533
paused or stopped, display the list of attributes for each point and
change the velocity to 0.
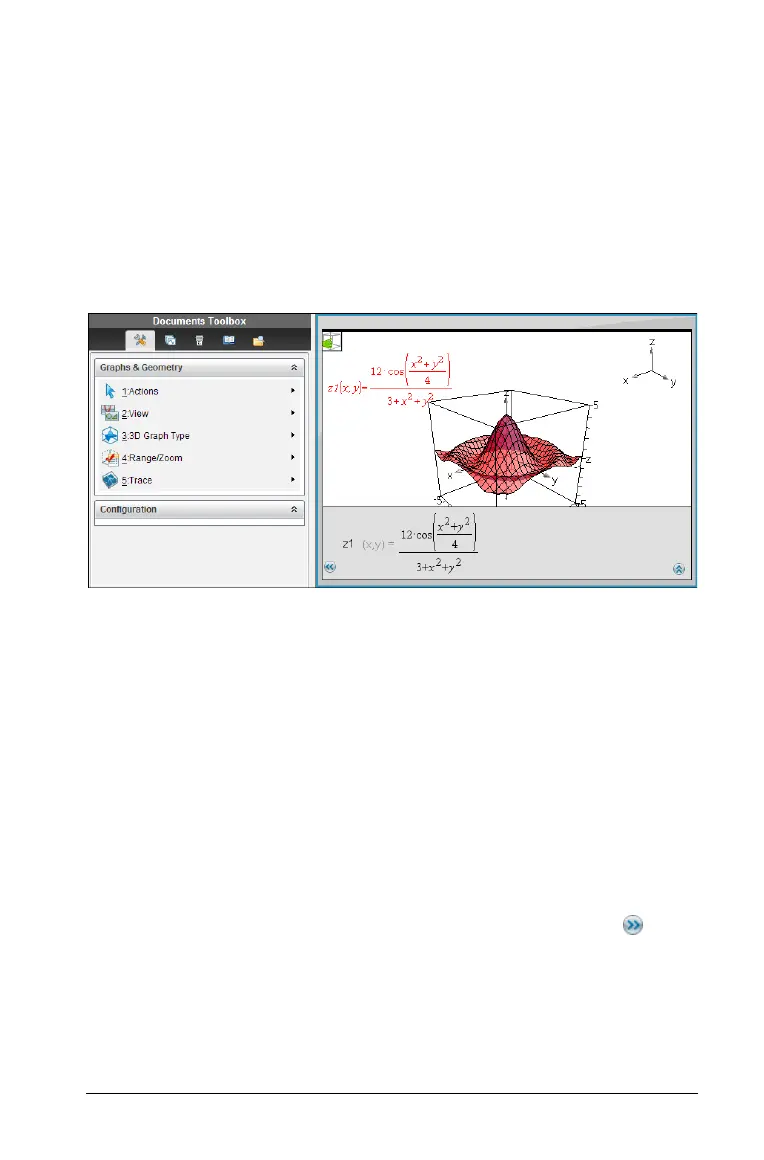
Graphing 3D functions
The 3D Graphing view lets you enter functions of the form z(x,y) and
view and explore them in three-dimensional space.
While you are in the 3D Graphing view, you can define, rotate, resize,
and trace 3D graphs. You can set the colors and other visual attributes of
a selected graph, and you can customize the 3D viewing environment.
À 3D Graphing menu. This menu is specific to 3D Graphing and is
accessible from the Graphs & Geometry View menu.
Á Icon of the current 3D tool (Rotation tool in this example). Press d
to close the tool and return to the Pointer tool.
 Sample 3D graph
à Entry line with expression that defines the graph
Ä Legend displaying orientation of the axes
Defining a 3D graph
Each 3D graphing page can show multiple graphs.
1. From the
View menu, select 3D Graphing.
2. If the entry line is hidden, click the
Show Entry Line button .
3. Type the expression that defines the graph.
4. Press
· to draw the graph.
Displaying the context menu of a 3D graph
Some 3D graphing features are accessible only through context menus.
À
Á
Â
Ã
Ä