Using Data & Statistics 619
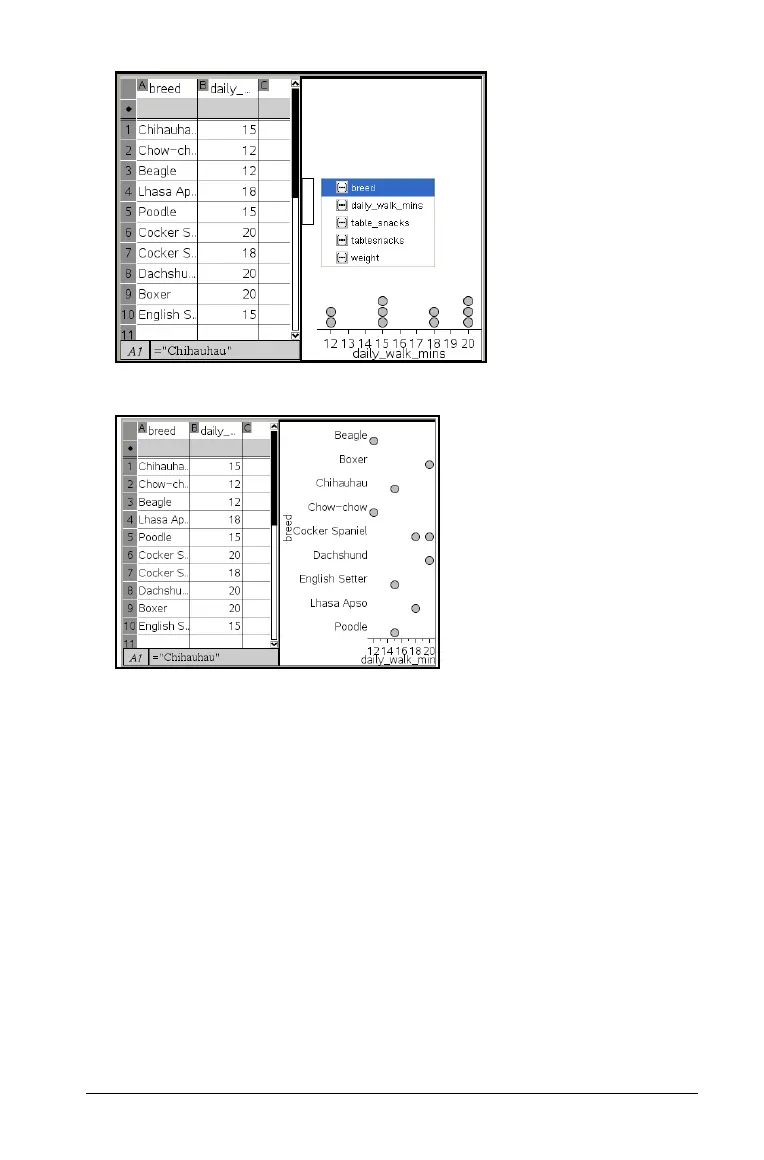
5. On the list of variables, click the name of the numeric variable.
Data & Statistics labels the vertical axis and plots the numeric data for
each category.
Exploring data
You can manipulate and explore plotted data.
• Select and move points or data bins
• Change the type of plot
• Rescale the graph
• Add a movable line
• Show regression lines
• Show residual squares
• Show a residual plot

 Loading...


