618 Using Data & Statistics
2. Click the column letter (A) to highlight the breed column.
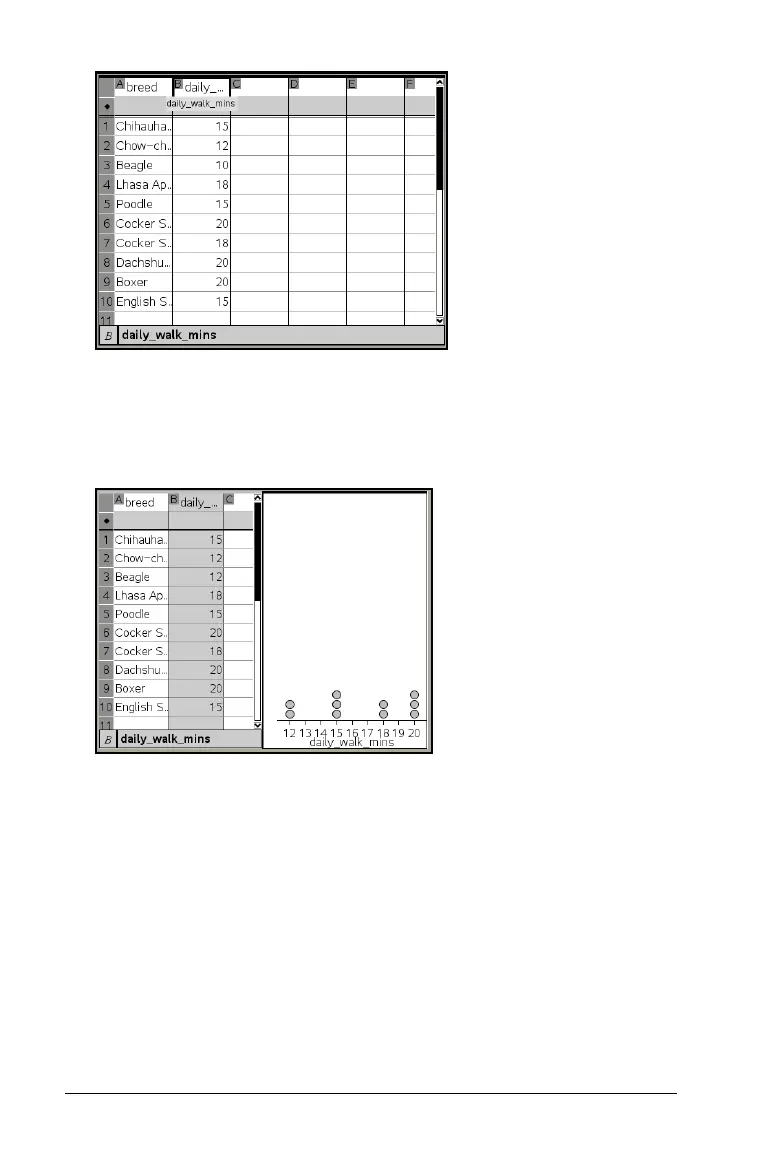
3. On the Lists & Spreadsheet Data menu, select the Quick Graph tool.
The Quick Graph tool adds a Data & Statistics page. Data & Statistics
plots the variable and labels the horizontal axis.
4. To plot the numeric data for each category, hover on the Add
Variable region near the center of the vertical axis and click the
tooltip Click or Enter to add variable.
The list of available variables displays.

 Loading...


