748 Data Collection and Analysis
Setting min and max axis ranges
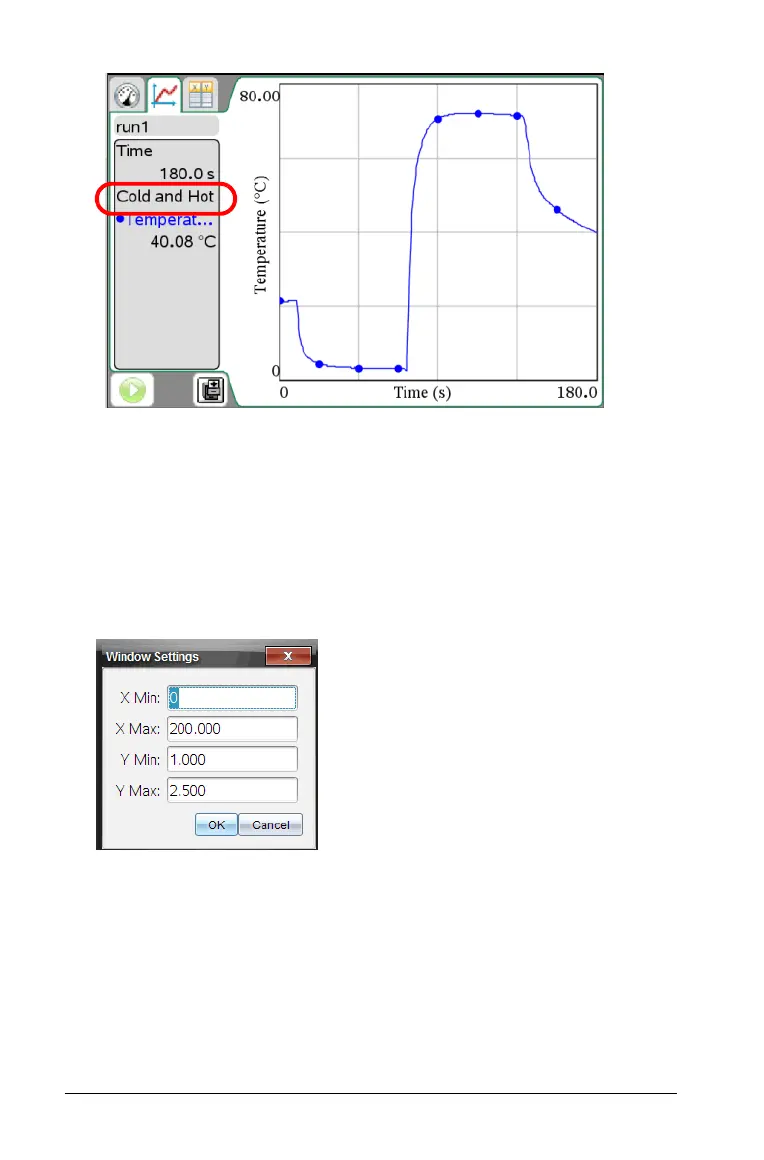
You can modify the minimum and maximum range for the x and y axis
using these procedures.
Setting the axis range using the menu
1. Select Graph > Window Setting.
The Windows Setting dialog box opens.
When you have two graphs there are two y axis minimum and
maximum values to enter but only one set of minimum and maximum
values for the x axis.

 Loading...


