732 Data Collection and Analysis
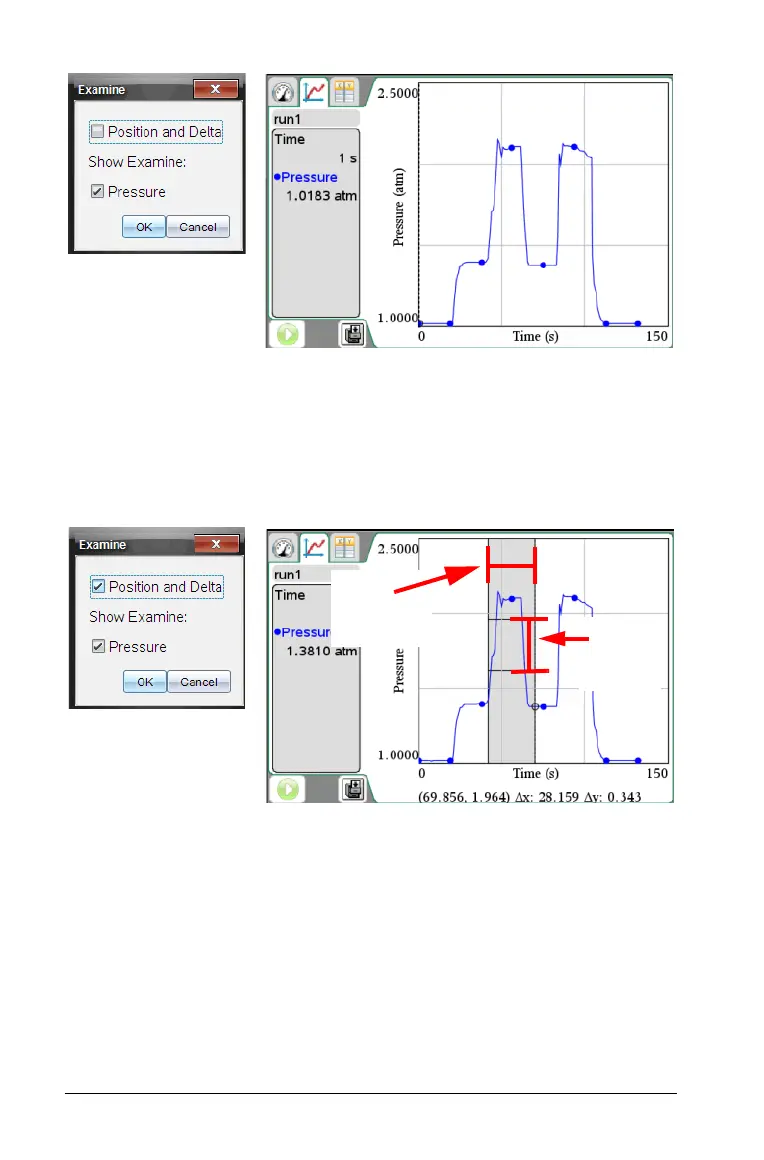
The following are example screens of the Examine dialog box and the
Graph View (with data) when both the Examine options and Position and
Delta are selected. This example also shows a selected range. (See
Selecting a range for instructions on how to select a range.)
Notice that the value and units are shown, and now position and delta
values are also shown under the graph.
Data analysis calculations
Integral
Use Integral to determine the area under a data plot. You can find the
area under all of the data or a selected region of the data. The value is
displayed in the View Details area and in the All Details for Graph dialog
box.
x-axis range
y-axis
range