Data Collection and Analysis 733
To view integral:
1. Leave the graph unselected to examine all the data, or select a range
to examine a specific area.
See Selecting a range for instructions on how to select a range.
2. Select
Analyze > Integral.
3. Select plotted column name if you have more than a single column.
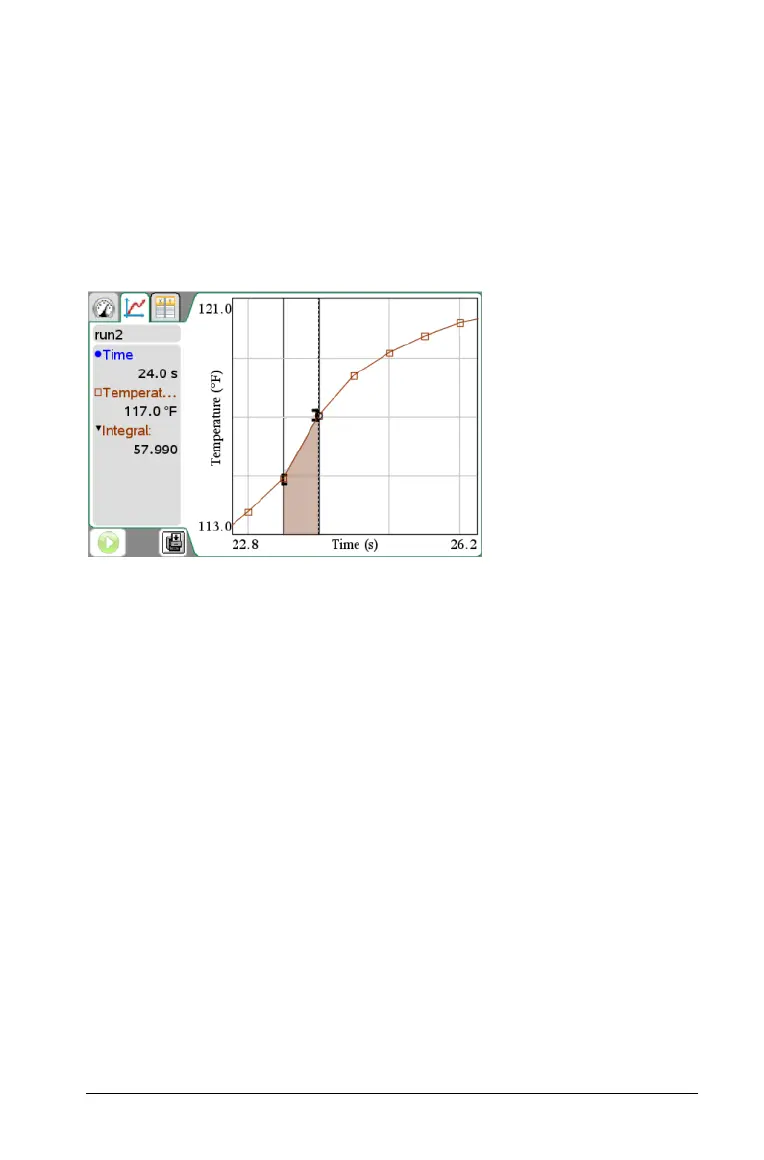
The following is an example with an area selected.
Statistics
Use this option to determine the statistics associated with the plotted
data. Minimum, maximum, mean, standard deviation, and number of
samples are calculated. You can find the statistics for all the data or a
selected region of data. The values are displayed in the View details area
and in the All Details for Graph dialog box.
To generate statistics:
1. Leave the graph unselected to examine all the data, or select a range
to examine a specific area.
See Selecting a range for instructions on how to select a range.
2. Select
Analyze > Statistics.
3. If you have more than a single column, select the plotted column
name (example: run1.Pressure) which you want to examine.

 Loading...


