734 Data Collection and Analysis
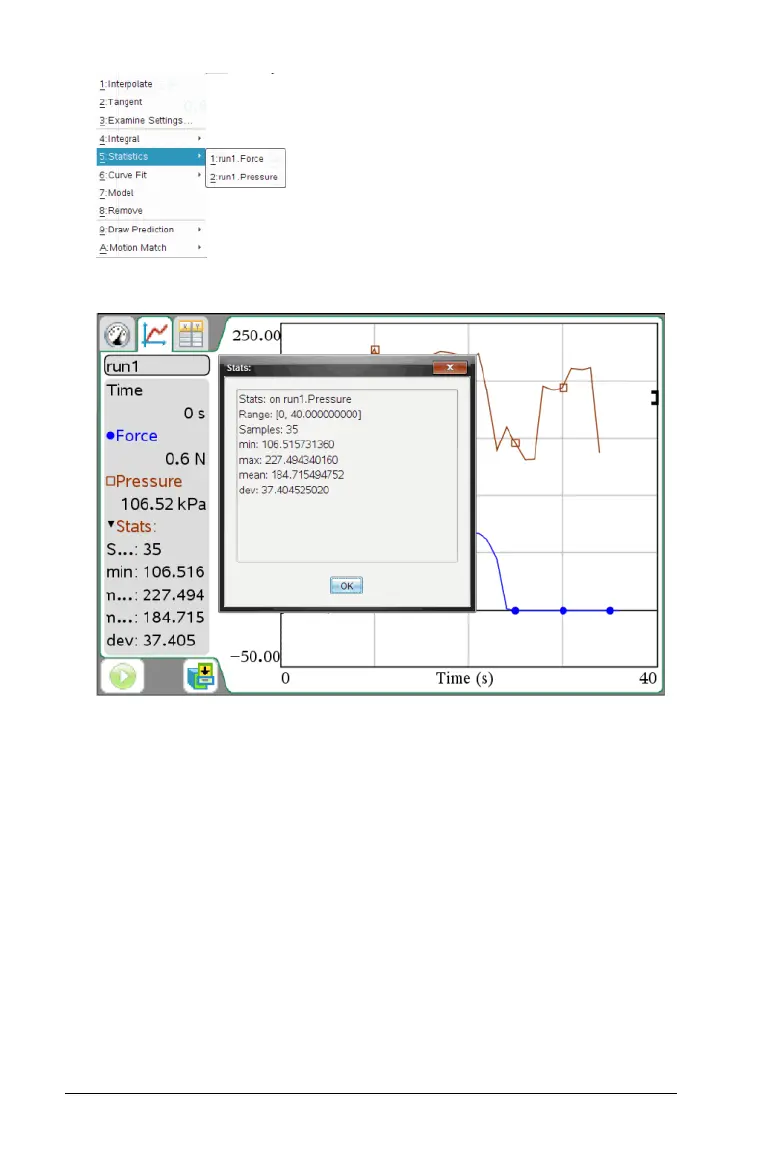
The statistics dialog box open.
4. Review the data and click OK when done.
Curve Fit
Find a best curve fit to match your data. Select all of the data or a
selected region of data. The curve is drawn on the graph and the
equation information is displayed in the View details area and in the All
Details for Graph dialog box.
To generate curve fit:
1. Leave the graph unselected to examine all the data, or select a range
to examine a specific area.
See Selecting a range for instructions on how to select a range.
2. Select
Analyze > Curve Fit.
3. Select the curve fit option from the menu.

 Loading...


