622 Using Data & Statistics
A text box with a default expression opens in the work area.
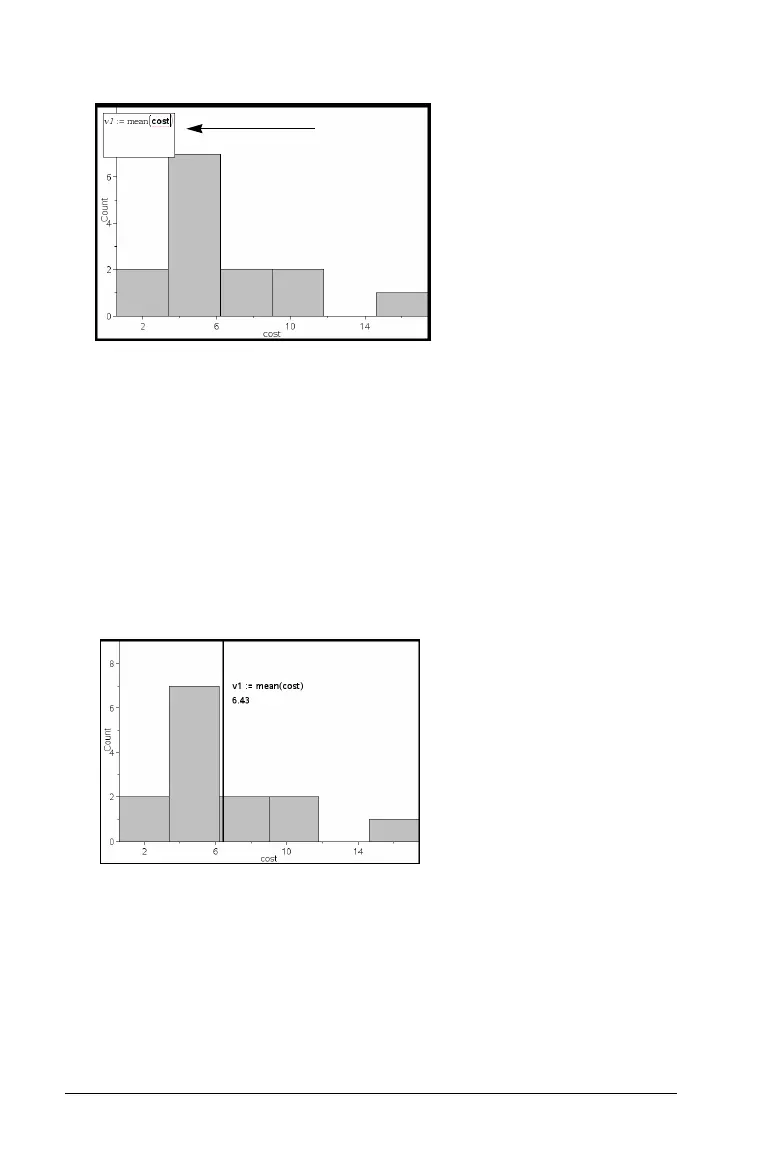
2. Type the value you want to plot, and press ·. In this example, the
value is v1:= mean(cost).
The line is drawn at that value, perpendicular to the axis. If you have
multiple plots on the work area, a plot value segment displays for
each plot.
Note: If you use a frequency table to generate a histogram, reference
the frequency list in your expression. For example, type the
expression ”v1:= mean(cost, frequency)” in the plot value entry box.
3. Click the line to display the value.
Note: Double-click the value to edit the expression.
You can use Plot value for a single number or any expression that
evaluates to a number. If the value is dependent on the data, like
mean, when you drag a point or make changes in the
Lists & Spreadsheet application, the line updates to reflect the
change, allowing for investigation of the influence of points on the
calculation.
Plot value
entry box
Plot value line with value displayed

 Loading...


