Graphs & Geometry 477
The sequence plot includes a point for each term of the sequence.
Note: If you plot a sequence and the variable used to specify it is later
changed to another type (such as to a Function), the plotted sequence
is automatically deleted.
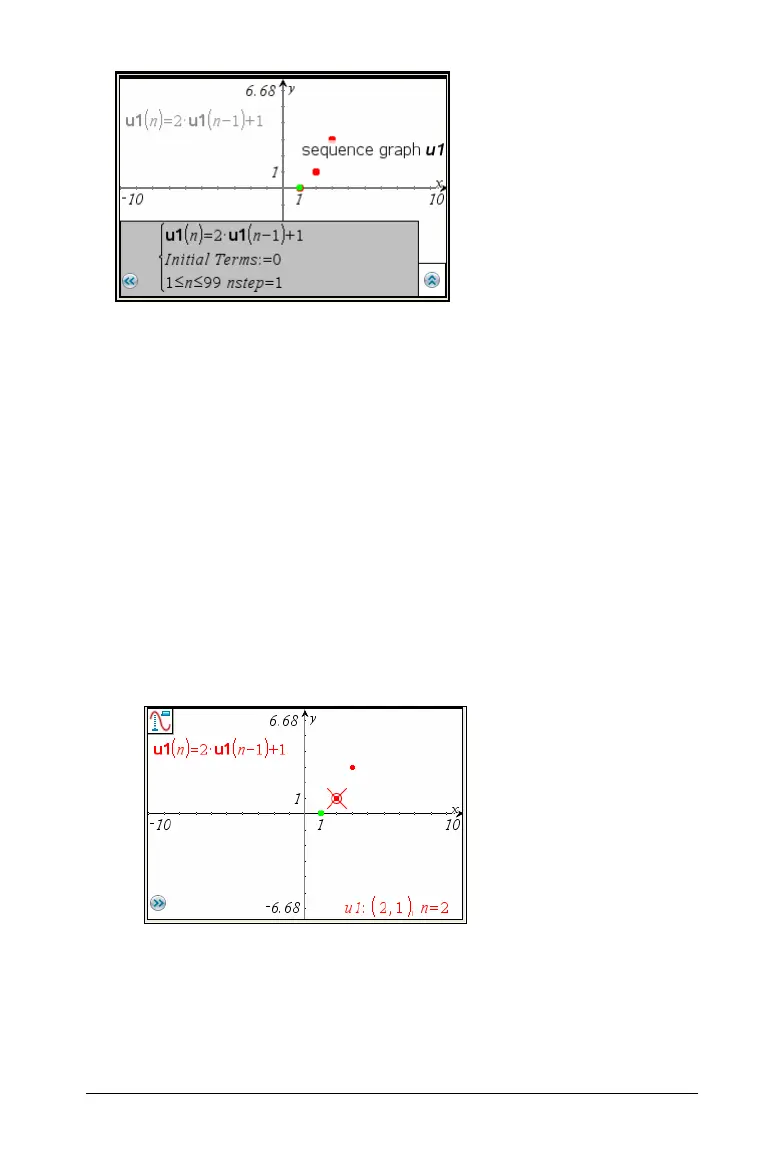
3. Click the sequence graph and use Graphs & Geometry tools to explore
the graphed sequence.
– Click the sequence graph to see its expression and the label for the
graph.
– Animate a slider assigned to use a variable included in a sequence
expression to observe changes in the plot.
– Right-click the work area and choose Graph Trace on the context
menu to move through and highlight values for the sequence.
Handheld: Press
/b and select Graph Trace to move
through and highlight values on the sequence graph.
– Press /T to display or hide a table of the values found while
evaluating the sequences at consecutive integer values.

 Loading...


