478 Graphs & Geometry
– Grab and drag the point that represents an initial term. As you
drag the term, its value changes. The sequence definition on the
entry line is updated automatically with the changes you make by
manipulating a term.
Creating a custom plot for a sequence
A custom plot lets you show the relationship between two sequences by
plotting one sequence on the x axis and the other on the y axis.
When you define a custom plot, you specify the variable names of two
defined sequences (from the Graphs & Geometry application) and assign
each to an axis. This section demonstrates how to create a custom plot
using the Predator-Prey model from biology to determine the numbers
of rabbits and foxes that maintain population equilibrium.
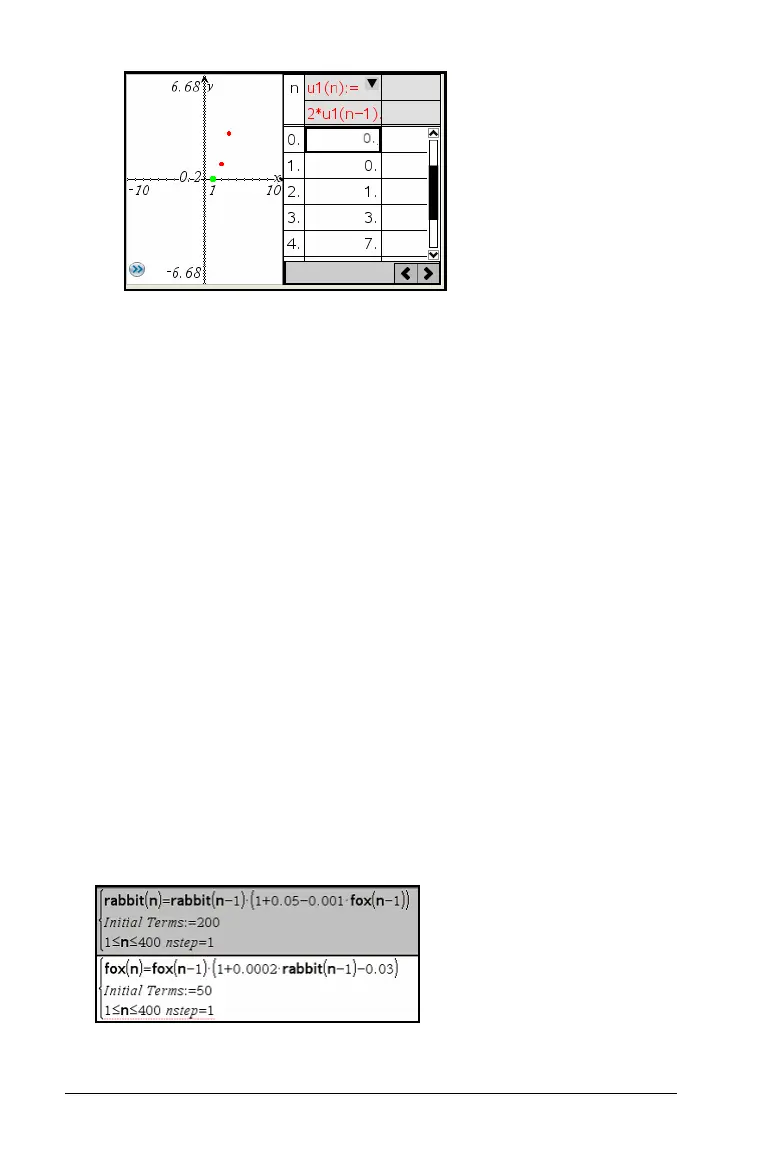
rabbit(n) = rabbit(n-1) * (1 +.05-.001 * fox(n-1))
fox(n) = fox(n-1) * (1 +.0002* rabbit(n-1) -.03), where:
.05 = the growth rate of rabbits if there are no foxes,
.001 = the rate at which foxes can kill rabbits,
.0002 = the growth rate of foxes if there are rabbits,
.03 = and the death rate of foxes if there are no rabbits.
1. On the
Graph Type menu, choose Sequence and select Sequence.
Use the model equation to define rabbit and fox sequences over a
cycle of 400 generations. Assume that there are 200 rabbits and 50
foxes initially.

 Loading...


