Graphs & Geometry 479
Note: For a less cluttered view, choose Hide/Show on the Actions
menu to hide the rabbit(n) and fox(n) sequences on the work area.
2. On the Graph Type menu, choose Sequence and select Custom.
3. Type rabbit(n) as the x-axis sequence, and then press e and type
fox(n)
as the y-axis sequence.
Note: You can also click
h to choose the name of a previously
defined sequence, or specify the name of a new sequence that you
can define later.
4. Press
e to move to the next line, and set the nstep and the range for
n. For this example, n is set between 1 and 400 and the nstep is the
default value, 1.
5. Press · to create the custom plot.
Note: Choose
Zoom - Fit on the Window/Zoom menu to adjust the
window settings.
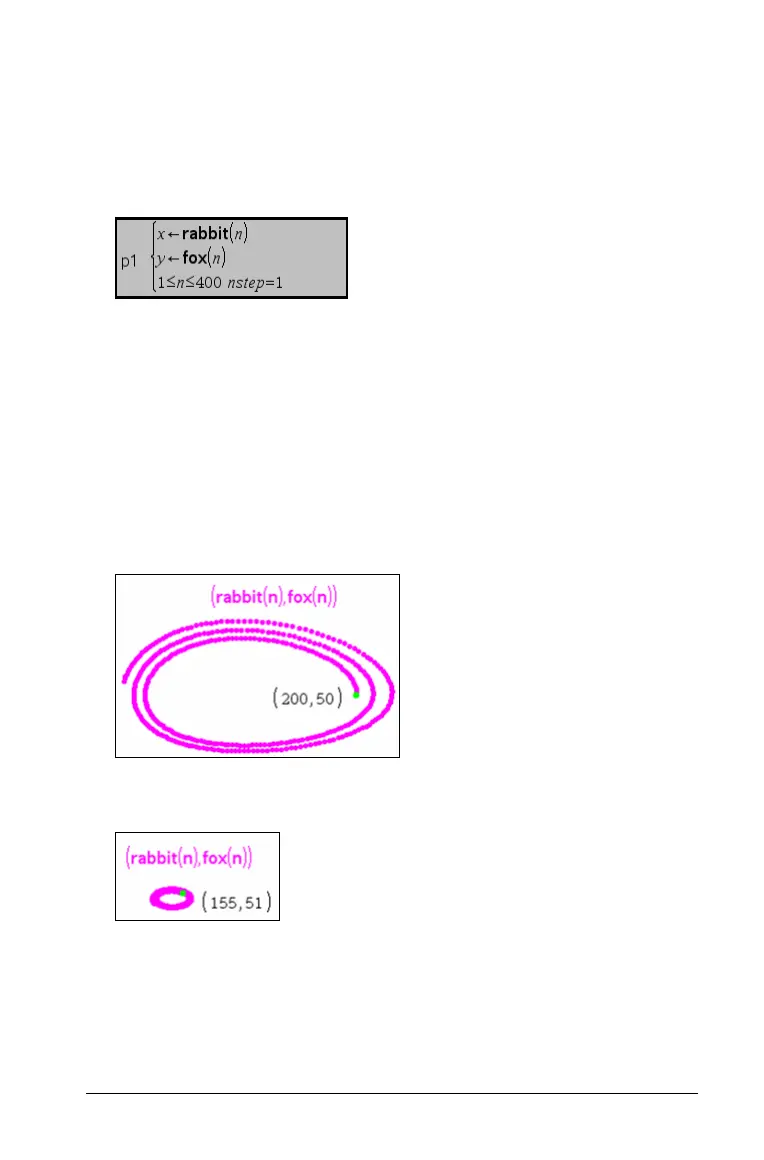
6. Explore the custom plot by grabbing and dragging the point that
represents the initial term.
As you drag the point, its value changes and the rabbit and fox initial
terms are automatically updated.

 Loading...


