Graphs & Geometry 493
The value of the derivative at the selected point displays on the
graph.
Note: To find the derivative at a specific value of x or y, use the
context menu of the point to show its coordinates, and then edit the
x or y coordinate.
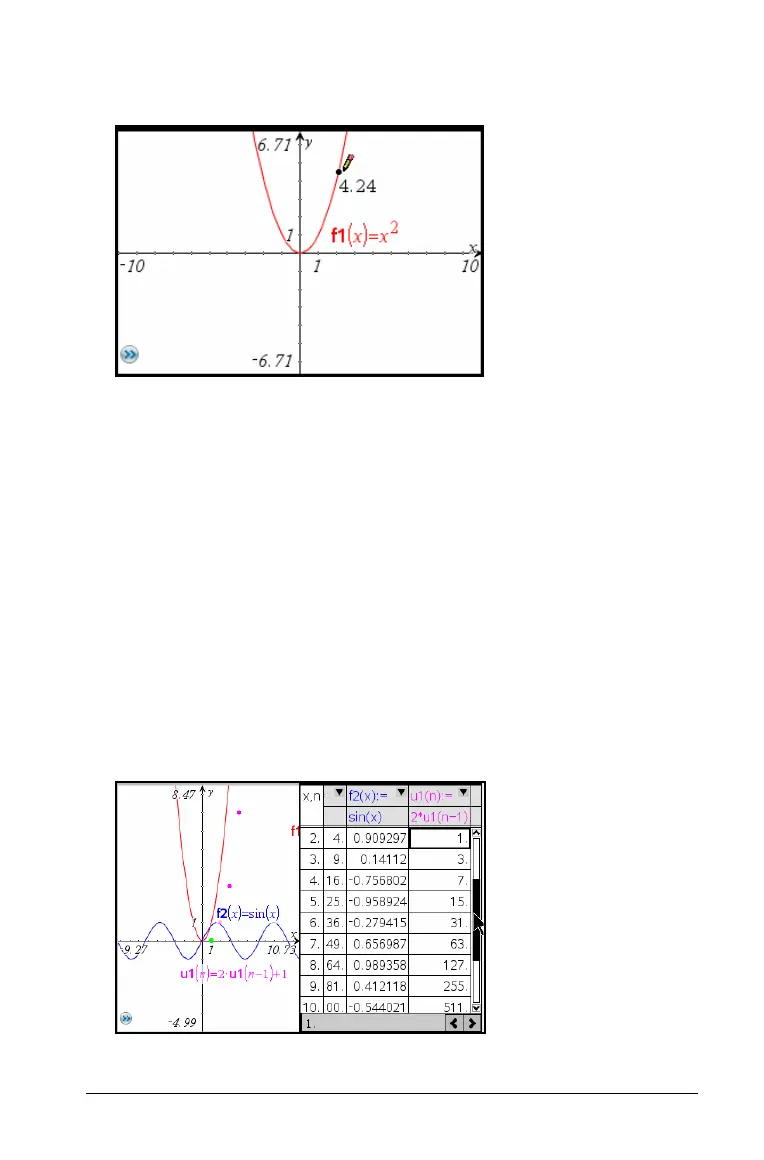
Viewing function tables
You can show a table of function values for any function in the current
problem.
While viewing the table, you can change the settings for the table,
delete columns, add values for multiple functions, and edit the
expression that defines a function. For details, refer to Using Lists &
Spreadsheet.
Showing the table
` From the View menu, select Show Table.
The table displays in a split screen, showing columns of values for the
currently defined functions.

 Loading...


