EasyManuals Logo

Texas Instruments TINSPIRE User Manual

Texas Instruments TINSPIRE
876 pages
To Next Page IconTo Next Page
To Previous Page IconTo Previous Page
Page #574 background imageLoading...
Page #574 background image
562 Using Lists & Spreadsheet
4. (Optional) Use the Data & Statistics features to analyze or visually
enhance the graph.
Note: Refer to Using Data and Statistics for information about
analyzing and exploring graphs.
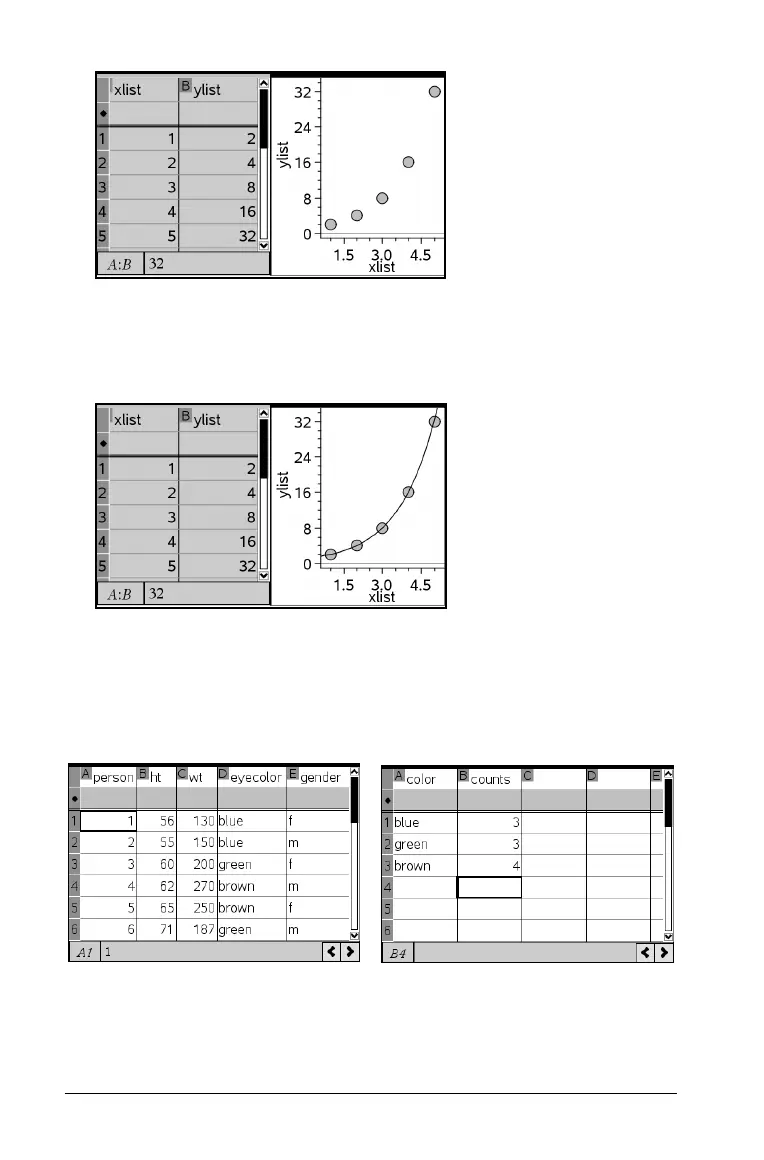
Creating a summary plot from a summary table
In this example, you create a summary table from raw data and then use
the table to generate a summary plot. For an example of how to create a
similar chart directly from the raw data, refer to the “Using
Data & Statistics” chapter.
A summary table contains an X (or Y) List and a Summary List.
raw data summary table for eye color based on
raw data

Table of Contents

Other manuals for Texas Instruments TINSPIRE

Questions and Answers:

Question and Answer IconNeed help?

Do you have a question about the Texas Instruments TINSPIRE and is the answer not in the manual?

Texas Instruments TINSPIRE Specifications

General IconGeneral
BrandTexas Instruments
ModelTINSPIRE
CategoryCalculator
LanguageEnglish

Related product manuals