610 Using Data & Statistics
1. In the Data & Statistics work area, click the Add Variable region and
select the variable that contains the data you want to see represented
on an axis.
The plot of the selected variable displays on the axis.
2. Click the Add Variable region of the other axis and select the variable
containing the data you to plot.
The data points shift to represent the data in the selected variable.
3. Analyze and explore the data in the plot.
– Click a point to select it.
– Hover over a data point to view the summary data.
– Work with the data using the available tools on the Analyze
menu. For example, choose the Graph Trace tool and press
¡ or ¢
to move across the plot.
4. Optional: To plot additional lists against the x-axis, right-click the
y-axis and select
Add Variable.
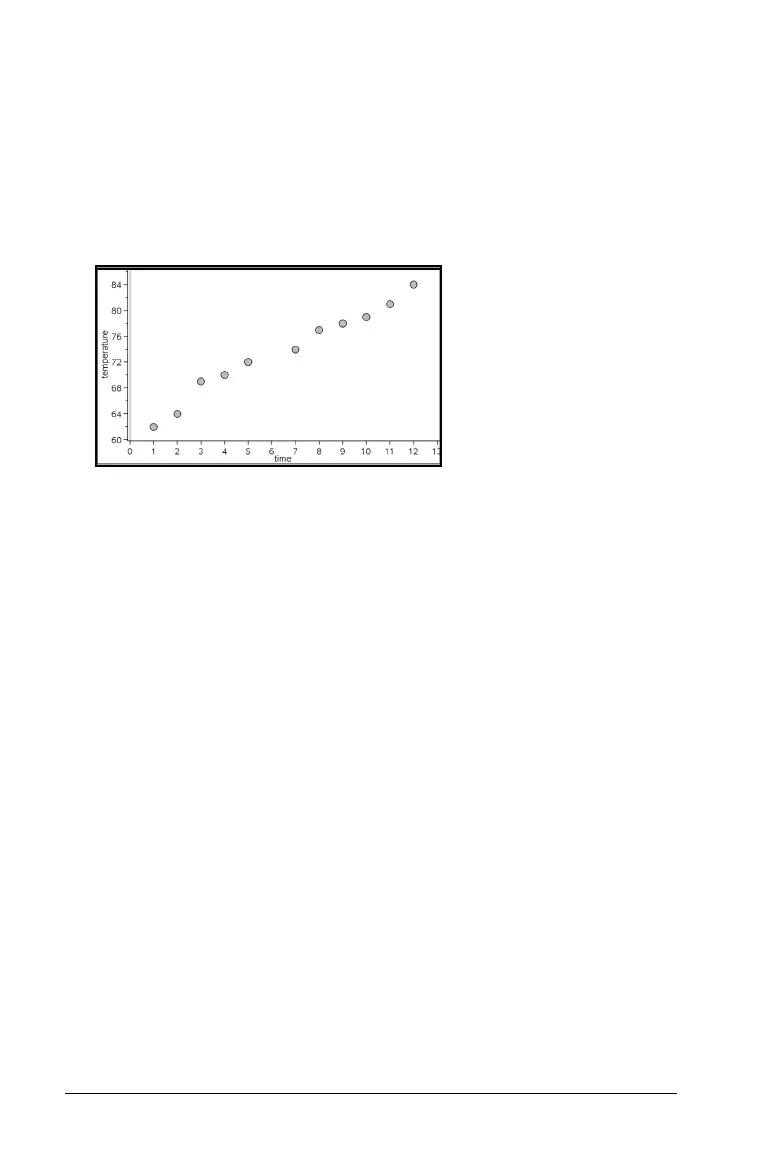
Creating an X-Y line plot
An X-Y line plot is a scatter plot in which the data points are plotted and
connected in order of appearance in the two variables. Like scatter plots,
these plots depict the relationship between two sets of data.
By convention, the left-most column of data is represented on the
horizontal axis.
1. Create a scatter plot. See Creating a scatter plot for details.
2. On the
Plot Types menu, select the XY Line Plot tool.
The data points within each set are connected to each other by a line.
 Loading...


