624 Using Data & Statistics
2. Click to grab. The cursor changes to ù. Drag the cursor to the desired
position and release.
Dilation
Dilation retains the shape of the axes, but enlarges or reduces the size.
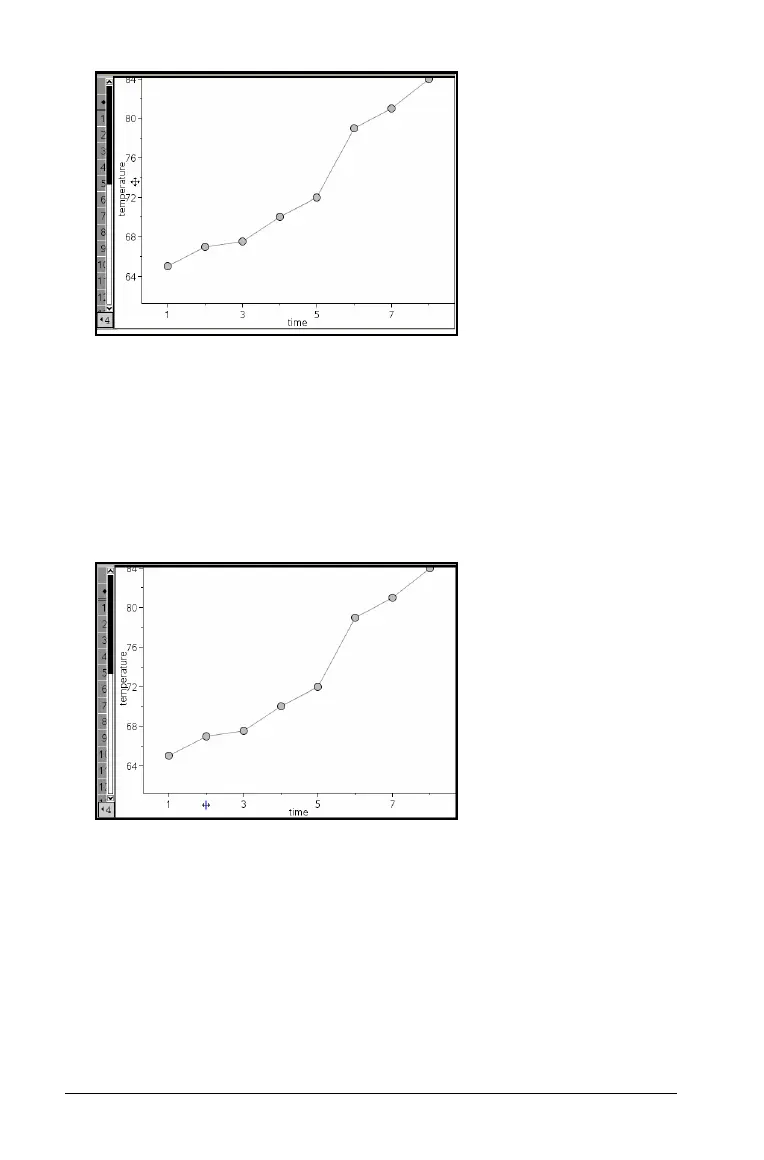
1. Position the cursor over a tic mark or label near the ends of the axis.
The cursor changes to
ó on the vertical axis or ô on the horizontal
axis.
2. Click to grab. The cursor changes to
÷. Drag the cursor to the desired
position and release.
Adding a movable line
You can add a movable line to a plot. Moving and rotating the line on
the work area changes the function that describes it.
` From the
Analyze menu, select Add Movable Line.
 Loading...


