630 Using Data & Statistics
Graphing functions using the Plot Function tool
You can use the Plot Function tool to plot functions in a work area that
already includes a plot on the axes. Plot Function lets you specify and
graph a function for comparison to an existing plot.
To use the Plot Function tool:
1. Create or open a problem that includes variables (from Lists &
Spreadsheet) that are plotted on a Data & Statistics work area. Ensure
that your work area contains both a horizontal axis and a vertical axis
scale.
2. From the
Analyze menu, select Plot Function.
A function entry field displays in the work area.
Note: You can edit the function’s expression typed in the entry field.
However, the function graphed in Data & Statistics cannot be
manipulated or moved around the work area. To do that, use Graphs
& Geometry.
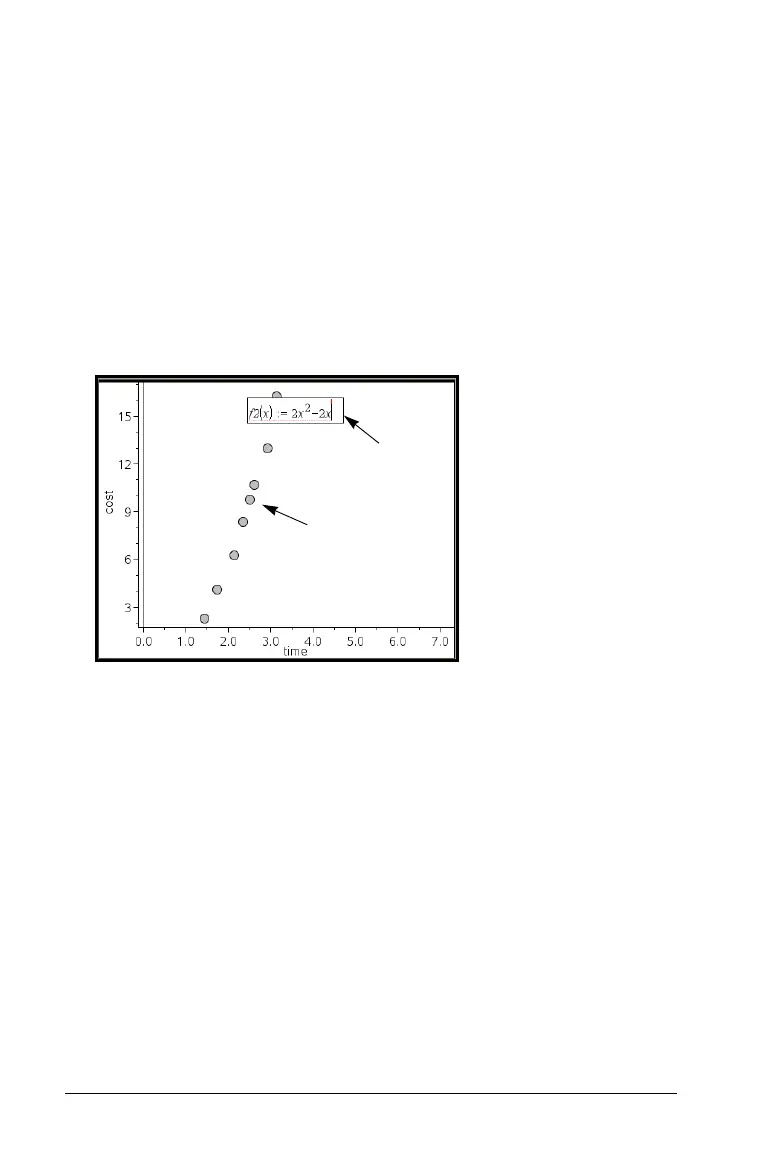
3. Type the function in the entry field, and press
·.
Note: You can rename the function by typing over f1(x): with another
name, if you choose.
The function graphs in the work area and is saved as a variable for
use in other applications.
Plot Function
entry field
Plot from
variables

 Loading...


