780 Data Collection and Analysis
Data can be struck in Graph View or Table View. You can strike data in
one view and review it in another (between Graph and Table views). You
cannot see struck data in Meter View.
Striking data in Graph View
1. To start this procedure, open a data set that contains data to be
struck.
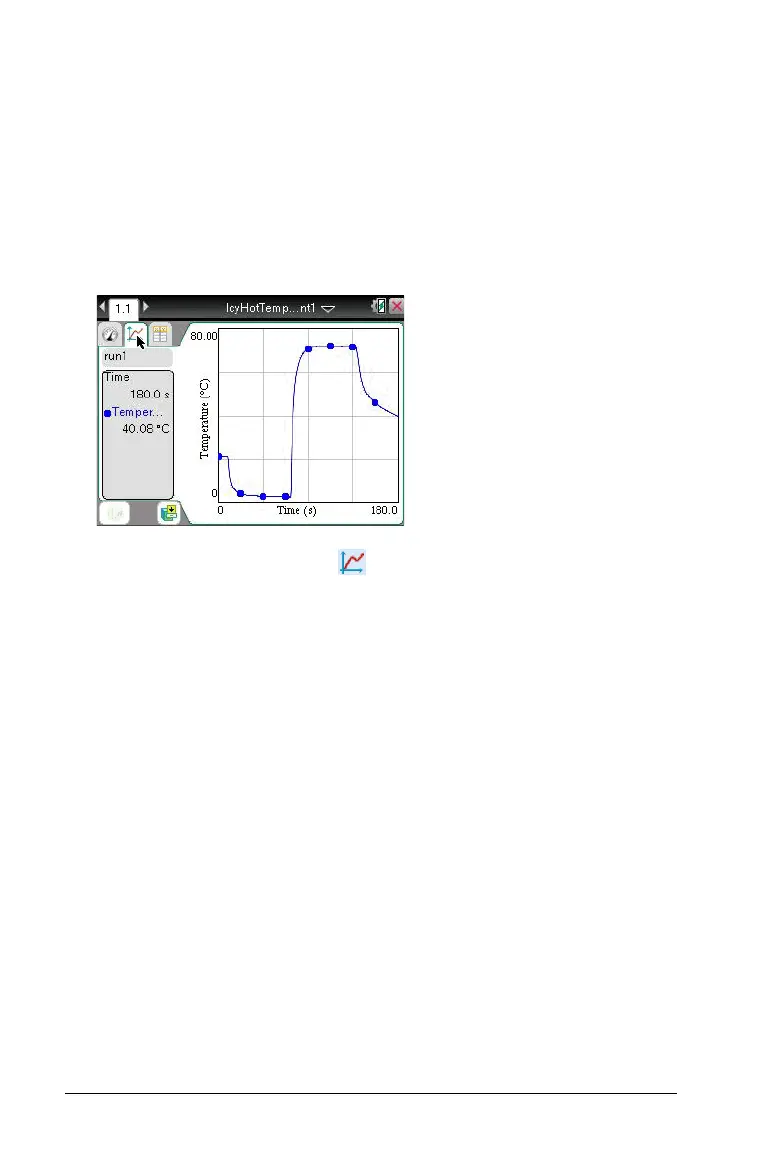
The following is an example graph with all data unstruck (before any
strike was performed):
2. Select View > Graph or click .
3. With your graph displayed, select the region you want to strike or to
protect from the strike. (See Selecting a range for instructions on how
to select a range.)
Note: You have the option to strike all data in the selected region or
strike all data outside the selected region.
4. Select Data > Strike Data or open the context menu in the graph and
select Strike Data.
Handheld: Click b and select Data > Strike Data or click
/ + b and select Strike Data.
5. Select one of the following:
•
In Selected Region: Strike the data from the area you selected.
•
Outside Selected Region: Strike all data except the area you
selected.
6. Click on the graph, off the selected area to remove the gray shading.

 Loading...


