Data Collection and Analysis 789
7. To show the same view, click the view to change, then select View >
Graph
(or the view you want) or click .
The window displays your change.
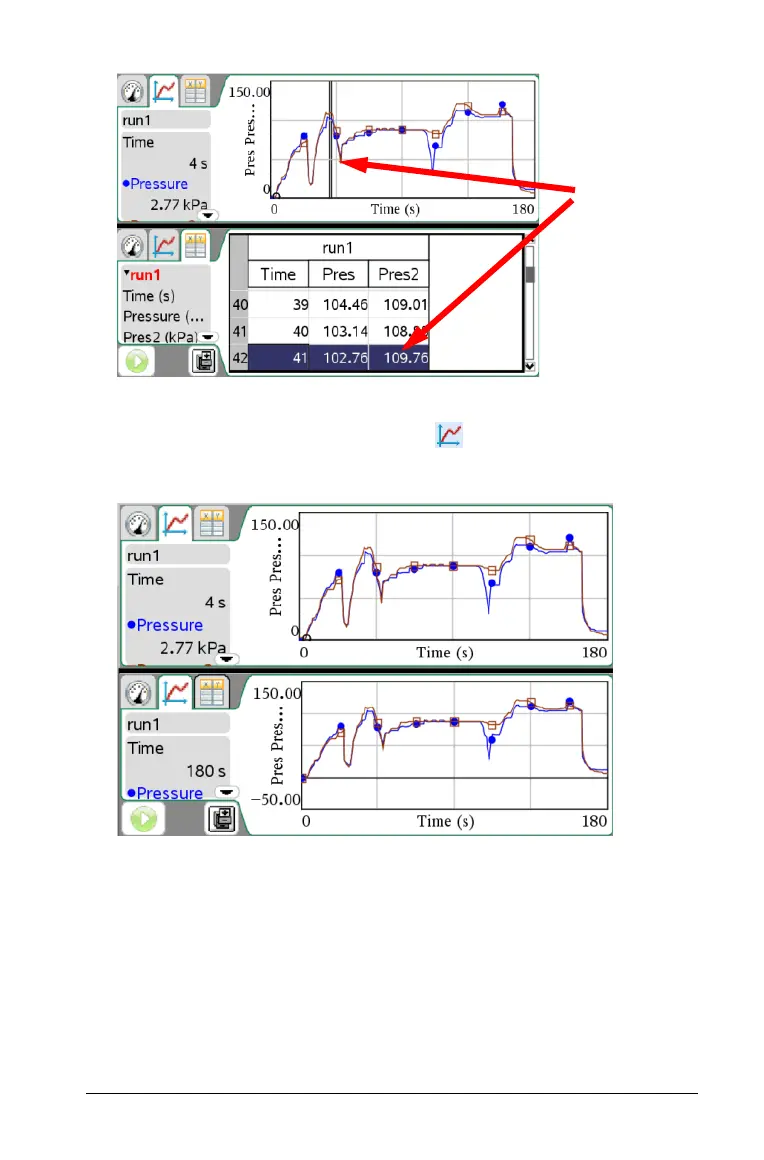
To show the plots separately:
8. Click the top graph to select it.
9. Select
Graph > Select Y-axis Columns.
10. Select the first Pressure value (or unit you are working with).
Note:
Selection
in one
view is
reflected
in the
other

 Loading...


