800 Data Collection and Analysis
You can now work with the data in the current application.
Special steps for Data and Statistics
When opening existing data in the TI-Nspire™ Data and Statistics
application, the data first displays as a Dot Point graph. There are
additional steps required to organize the points.
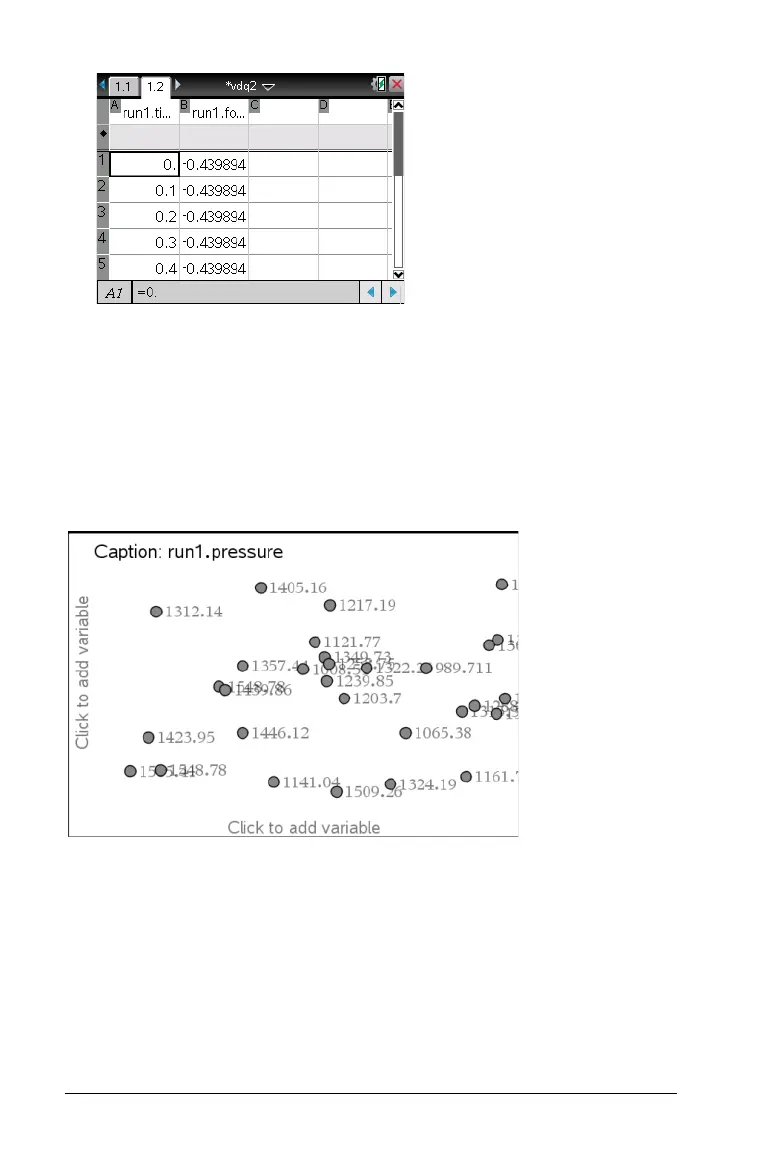
The following image is an example of existing data opened as a Dot
Point graph in the Data and Statistics application:
This procedure assumes you have already collected data in another
application.
1. Open the Data and Statistics application with the existing data.
2. Click on the y-axis side of the text on the screen “Click to add
variable.”
3. Select the variable.
4. Click on the x-axis side of the text on the screen “Click to variable.”

 Loading...


