No. Name Description Analog Output Level Unit
U2-17 Motor d-Axis Current at Previous Fault Displays the d-axis current for the motor at the previous fault. No signal output avail. 0.10%
Note: Two digits for 11kW or less, one digit for larger units.
u
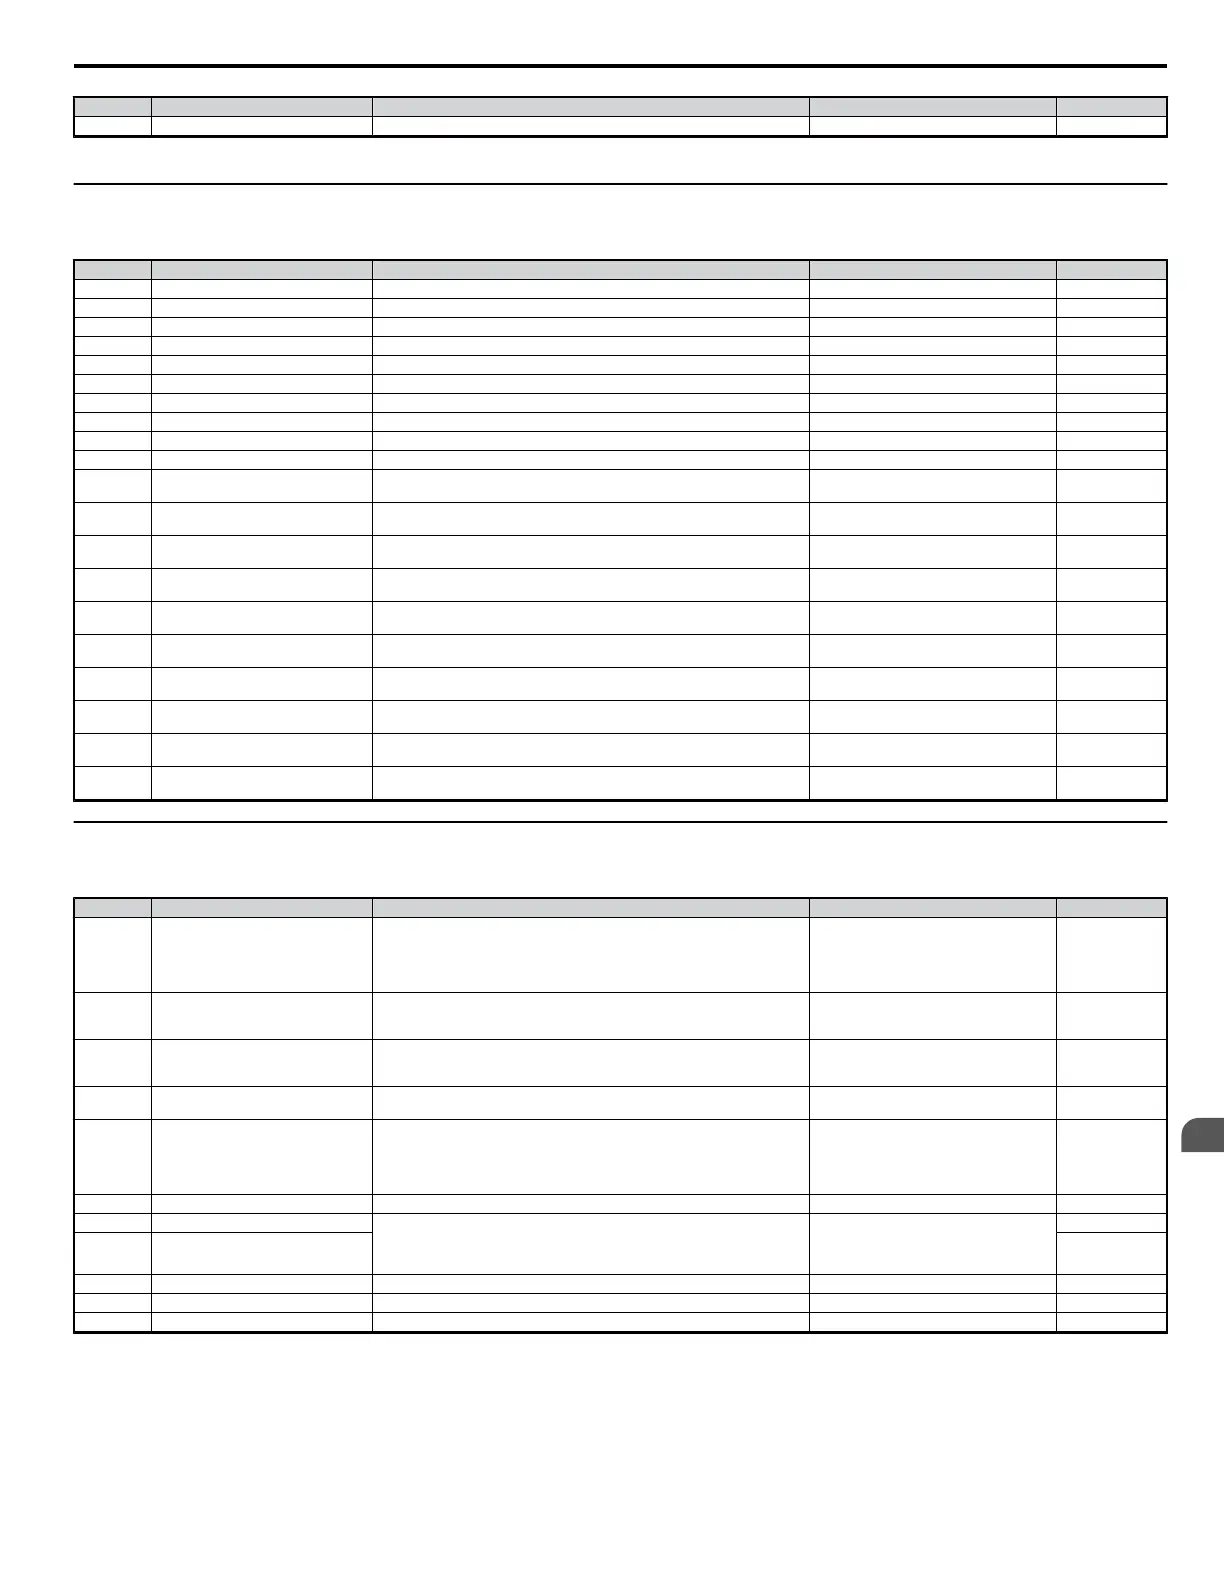
U3: Fault History
These parameters display faults that have a occurred during operation and when they occurred.
No. Name Description Analog Output Level Unit
U3-01 Most Recent Fault Displays the most recent fault. No signal output avail. –
U3-02 2nd Most Recent Fault Displays the second most recent fault. No signal output avail. –
U3-03 3rd Most Recent Fault Displays the third most recent fault. No signal output avail. –
U3-04 4th Most Recent Fault Displays the fourth most recent fault. No signal output available –
U3-05 5th Most Recent Fault Displays the fifth most recent fault. No signal output available –
U3-06 6th Most Recent Fault Displays the sixth most recent fault. No signal output available –
U3-07 7th Most Recent Fault Displays the seventh most recent fault. No signal output available –
U3-08 8th Most Recent Fault Displays the eighth most recent fault. No signal output available –
U3-09 9th Most Recent Fault Displays the ninth most recent fault. No signal output available –
U3-10 10th Most Recent Fault Displays the tenth most recent fault. No signal output available –
U3-11
Cumulative Operation Time at Most
Recent Fault
Displays the cumulative operation time at the most recent fault. No signal output available 1 h
U3-12
Cumulative Operation Time at 2nd
Most Recent Fault
Displays the cumulative operation time at the second most recent fault. No signal output available 1 h
U3-13
Cumulative Operation Time at 3rd
Most Recent Fault
Displays the cumulative operation time at the third most recent fault. No signal output available 1 h
U3-14
Cumulative Operation Time at 4th
Most Recent Fault
Displays the cumulative operation time at the fourth most recent fault. No signal output available 1 h
U3-15
Cumulative Operation Time at 5th
Most Recent Fault
Displays the cumulative operation time at the fifth most recent fault. No signal output available 1 h
U3-16
Cumulative Operation Time at 6th
Most Recent Fault
Displays the cumulative operation time at the sixth most recent fault. No signal output available 1 h
U3-17
Cumulative Operation Time at 7th
Most Recent Fault
Displays the cumulative operation time at the seventh most recent fault. No signal output available 1 h
U3-18
Cumulative Operation Time at 8th
Most Recent Fault
Displays the cumulative operation time at the eighth most recent fault. No signal output available 1 h
U3-19
Cumulative Operation Time at 9th
Most Recent Fault
Displays the cumulative operation time at the ninth most recent fault. No signal output available 1 h
U3-20
Cumulative Operation Time at 10th
Most Recent Fault
Displays the cumulative operation time at the tenth most recent fault. No signal output available 1 h
u
U4: Maintenance Monitors
Maintenance monitors are used to indicate when various components require replacement.
No. Name Description Analog Output Level Unit
U4-01 Accumulated Operation Time
Displays the cumulative operation time of the drive. The value for the
cumulative operation time counter can be set in parameter o4-01. Use
parameter o4-02 to determine if the operation time should start as soon as the
power is switched on or only while the run command is present. The maximum
number displayed is 99999, after which the value is reset to 0.
No signal output avail. 1 h
U4-02 Number of Run Commands
Displays the number of times the run command is entered. Reset the number
of run commands using parameter o4-13. This value will reset to 0 and start
counting again after reaching 65535.
No signal output avail.
U4-03 Cooling Fan Operation Time
Displays the cumulative operation time of the cooling fan. The default value
for the fan operation time is set to parameter o4-03. This value will reset to 0
and start counting again after reaching 65535.
No signal output avail. 1H
U4-05 Capacitor Maintenance
Displays main circuit capacitor usage time in percent of their expected
performance life. Parameter o4-06 resets this monitor.
No signal output avail. 1%
U4-07 IGBT Maintenance
Displays IGBT usage time as a percent of expected performance life. One of
the multi-function contact outputs can be set to close when the value reaches
50% (H2-oo = 2F), triggering an alarm. One of the multi-function contact
outputs can be set to close when the value reaches 90% (H2-oo = 10),
triggering an alarm. Parameter o4-09 resets this monitor.
No signal output avail. 1%
U4-09 LED Check Lights all segments of the LED to verify that the display is working properly. No signal output avail. –
U4-10 kWH, Lower 4 Digits Monitors the drive output power. The value is shown as a 9 digit number
displayed across two monitor parameters, U4-10 and U4-11. Example:
12345678.9 kWh is displayed as:U4-10: 678.9 kWhU4-11: 12345 MWh
Analog monitor: No output signal available.
No signal output avail.
kWh
U4-11 kWH, Upper 5 Digits MWh
U4-13 Peak Hold Current Displays the peak hold current during run. 10 V: Motor rated current 0.01A
U4-14 Peak Hold Output Frequency Displays the output frequency when operating at the peak hold current. 10 V: Max frequency 0.01Hz
U4-16 Motor Overload Estimate (OL1) 100% = OL1 detection level 100% = OL1 detection level 0.1%
5.12 U: Monitor Parameters
YASKAWA ELECTRIC SIEP C710606 18A YASKAWA AC Drive – V1000 Technical Manual (Preliminary)
217
5
Parameter Details
 Loading...