Configuring RMON History Introduction
7-105
Software Reference for SwitchBlade x3100 Series Switches (Network Management)
SHOW INTERFACE COUNTER
Syntax
SHOW INTERFACE={ type: | type:id-range | id-range | ifname-list |
ALL } COUNTER [ { STATUS | FULL } ]
Description The SHOW INTERFACE COUNTER command displays current statistical RMON counts
for selected interfaces as well as status information about the interfaces.
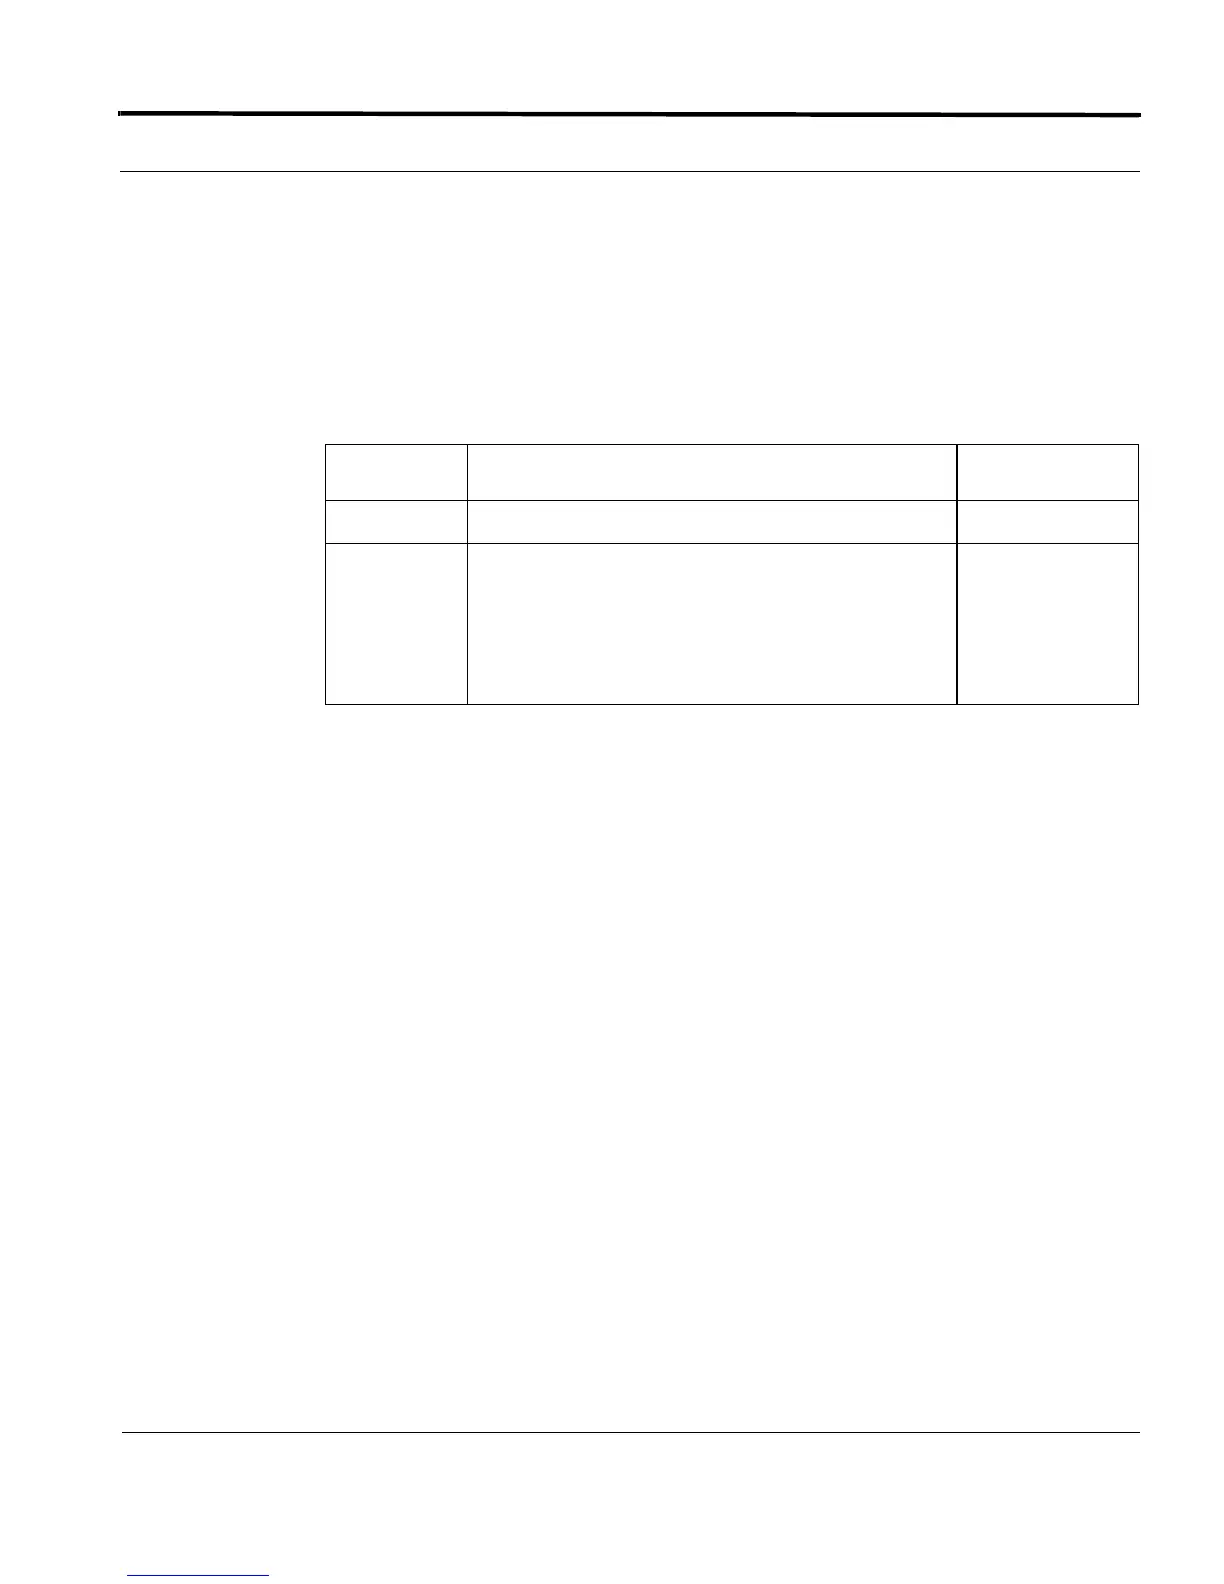
Options The following table gives the range of values for each option that can be specified with
this command and a default value (if applicable).
Example
E135 - officer SEC>> SHOW INTERFACE=LAG:* counter STATUS
--- Ether Statistics ---
Interface State Status Packets Octets
------------ ----- -------------- -------------------- --------------------
LAG:0 On Collecting 24885 2072215
LAG:1 On Collecting 827 52928
LAG:2 On Collecting 0 0
LAG:3 On Collecting 3082 197248
LAG:4 On Collecting 0 0
LAG:5 Off Not Collecting - -
LAG:6 On Collecting 2659 170176
7.5.8 Configuring RMON History
To collect RMON historical data, the user must associate an interface or set of interfaces with the number of
buckets and the interval in which each bucket collects data.
7.5.8.1 Sample Configuration
Figure 7-15 shows a possible traffic monitoring configuration that has the following:
• Traffic is being collected for one of the ports on the GE3 card.
Option Description Default Value
INTERFACE The interface that will show the counts
COUNTER The number of times a counter increments on the inter-
face for a statistic.
STATUS - shows the thresholds that have been set.
FULL - shows full information for the specified com-
mand entered.
 Loading...