7.1 Reading Measurement Values (Using the A/B Cursors)
103
7
Chapter 7 Waveform Screen Monitoring and Analysis
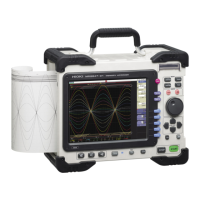
<Screen display (time axis cursor)>
You can press the DISP key to display the waveform and cursor values separately.
See: "7.7.3 Switching the Waveform Display Width" ( p.114)
Reading Measurement Values on Waveform Screen (for 1, 2, 4, 8 screens)
To open the screen: Press the DISP key → Waveform screen
A Cursor B Cursor
Frequencies
Time Values
Waveform values at the intersection with
each cursor are displayed.
Values Between
A/B cursors
Time Value
To change the display type:
"Time Value" (
p.256)
How cursor values are
displayed depends on
the selected cursor type.
Cursor A
Values
Cursor B
Values
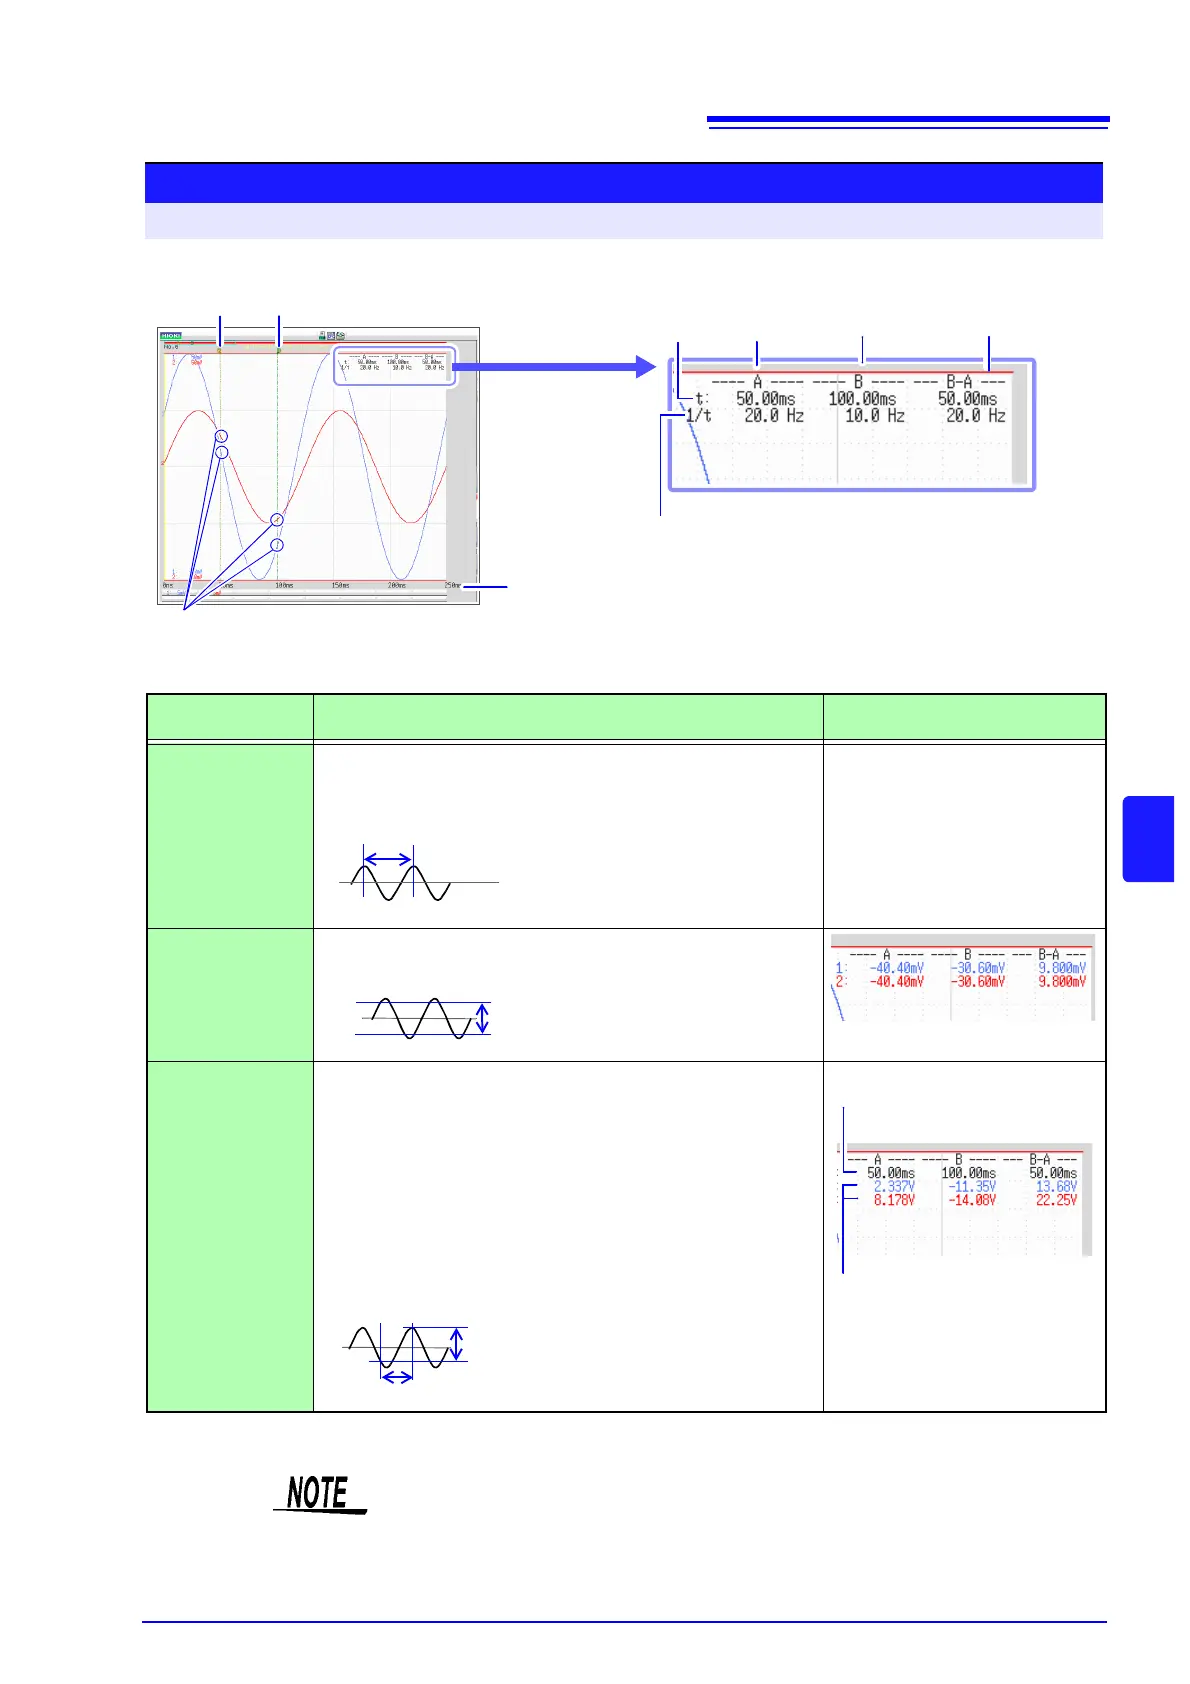
<Cursor Value>
Cursor Type Cursor Value
Cursor Value Display Example
(with two cursors)
div
(Time Value and
Frequency)
t:A, B each cursor value: Time from trigger point or recording
start
B-A value: Time difference between A/B cursors
See "Screen display" above
1/t: Frequency for which t is 1 cycle
Range
(Measurement
Values)
A, B each cursor value: Measured value of channel
B-A value: Difference between measured values at A/B cursors
Trace
(Time and Mea-
surement Values)
Time Values
A, B each cursor value: Time from trigger point or recording
start
B-A value: Time difference between A/B cursors
Measurement Values
A, B each cursor value: (Memory function) measurement value
(Recorder function) maximum, mini-
mum values
B-A value: Difference between measured values at A/B cursors
Time Values
Measurement Values
A
B
B-A
B-A
(Time difference)
(Difference between measured values)
• When Using External Sampling: Value t is the number of samples.
• When the voltage range is changed during measurement by the recorder func-
tion or X-Y recorder function: Trace measurement values are acquired at the
range settings when measurement was stopped.