13.9 FFT Analysis Modes
241
13
Chapter 13 FFT Function
Waveform Example
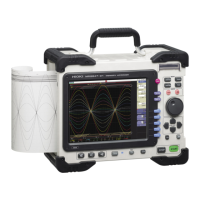
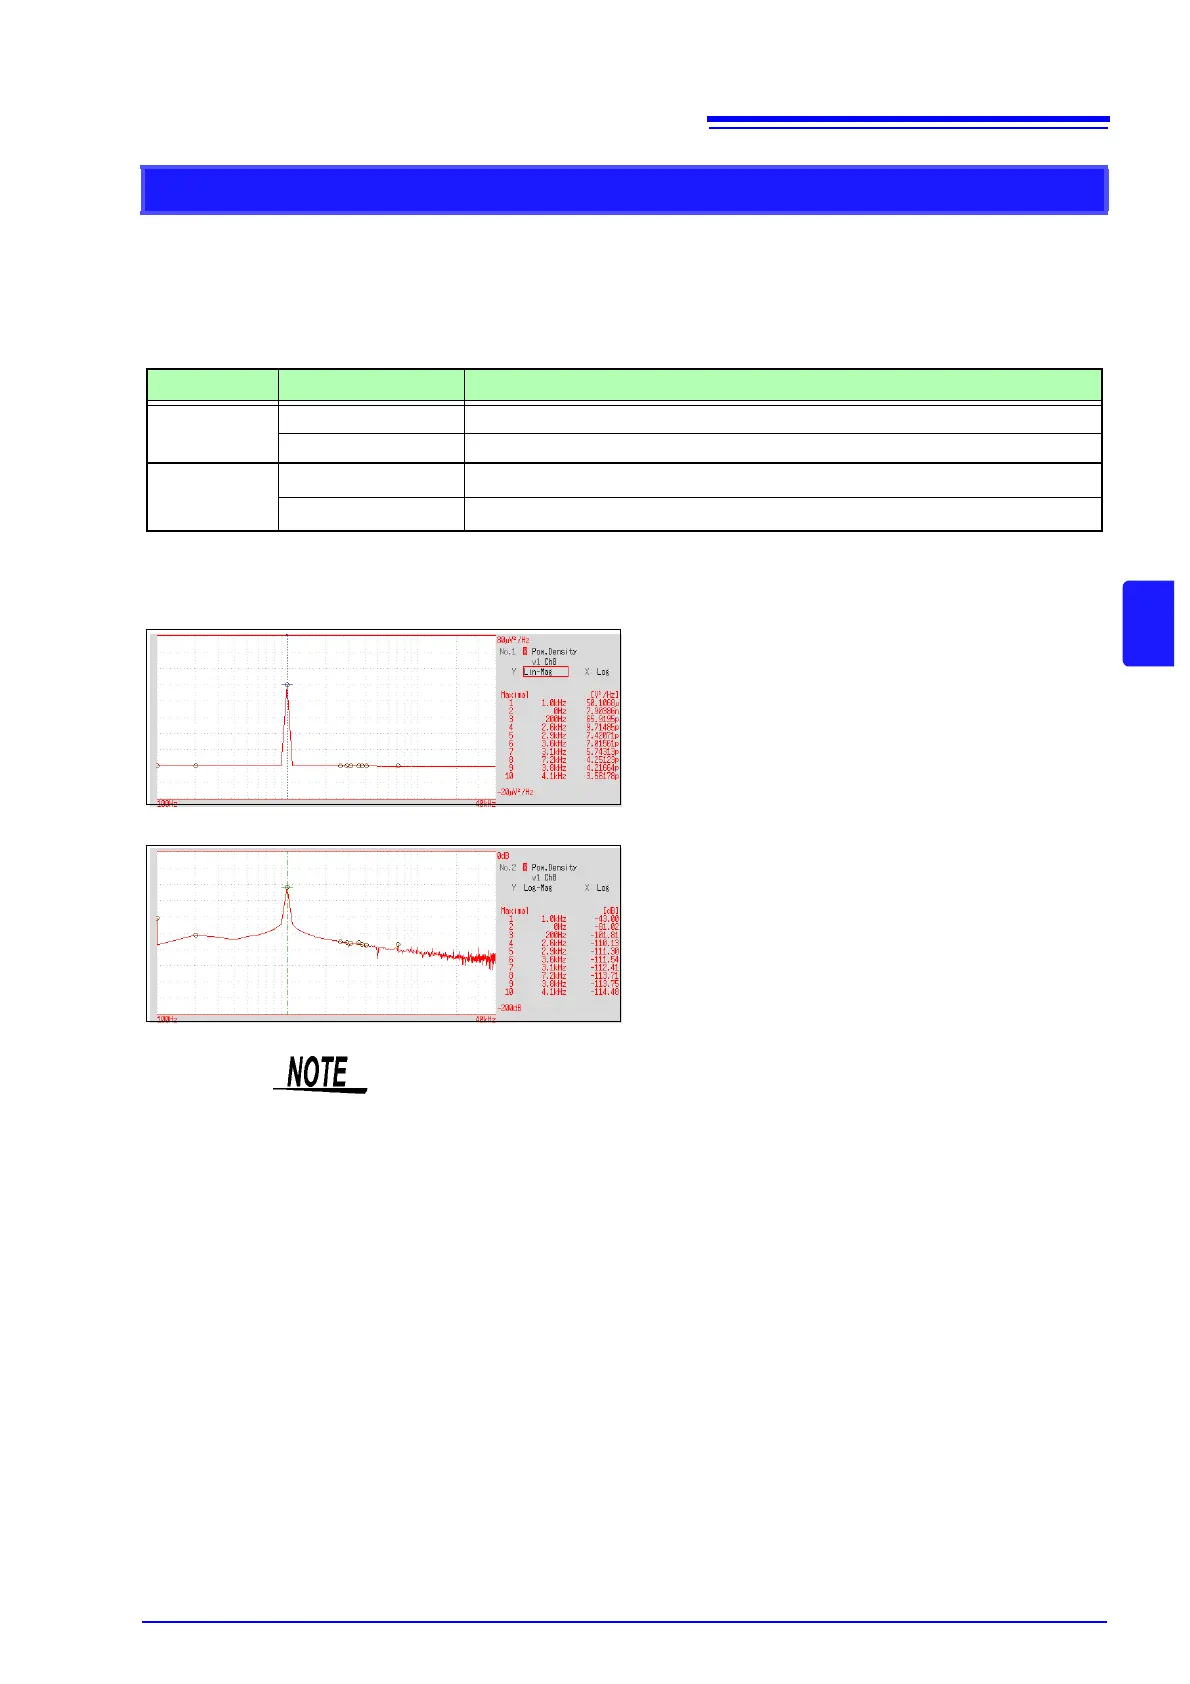
Power Spectrum Density
Indicates the power spectrum density of the input signal with only the amplitude component
included. This is the power spectrum divided by the frequency resolution.
Main uses:
To acquire a power spectrum with 1-Hz resolution for highly irregular waveforms such as white noise
See: About the Functions"13.9.2 Analysis Mode Functions" ( p.254)
Axis Display Type Description
X axis
Linear Frequency is displayed with equal spacing
Log Frequency display of logarithm interval
Y axis
Lin-Mag
Analysis values are displayed linearly.
Log-Mag(logarithm)
Analysis values are displayed as dB values. (0 dB reference value: 1eu
2
/Hz)*
* eu: engineering units that are currently set are the standard (e.g., when the unit settings is volts, 0 dB = 1 V
2
/Hz)
Normal display
X axis: Log
Y axis: Lin-Mag
Normal display
X axis: Log
Y axis: Log-Mag
Not available with external sampling enabled.