13.9 FFT Analysis Modes
242
Waveform Example
LPC (Power Spectrum Density )
When the spectrum shape is complex and hard to comprehend with either linear or power spectra, a
rough spectrum structure can be obtained.Main uses:
To obtain a spectral envelope using statistical methods
See: About the Functions"13.9.2 Analysis Mode Functions" ( p.254)
Axis Display Type Description
X axis
Linear Frequency is displayed with equal spacing
Log Frequency display of logarithm interval
Y axis
Lin-Mag The analysis data is displayed linearly.
Log-Mag(logarithm)
Analysis values are displayed as dB values. (0 dB reference value: 1eu
2
/Hz)*
* eu: engineering units that are currently set are the standard (e.g., when the unit settings is volts, 0 dB = 1 V
2
/Hz)
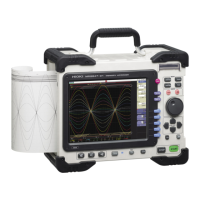
X axis: Log
Y axis: Lin-Mag
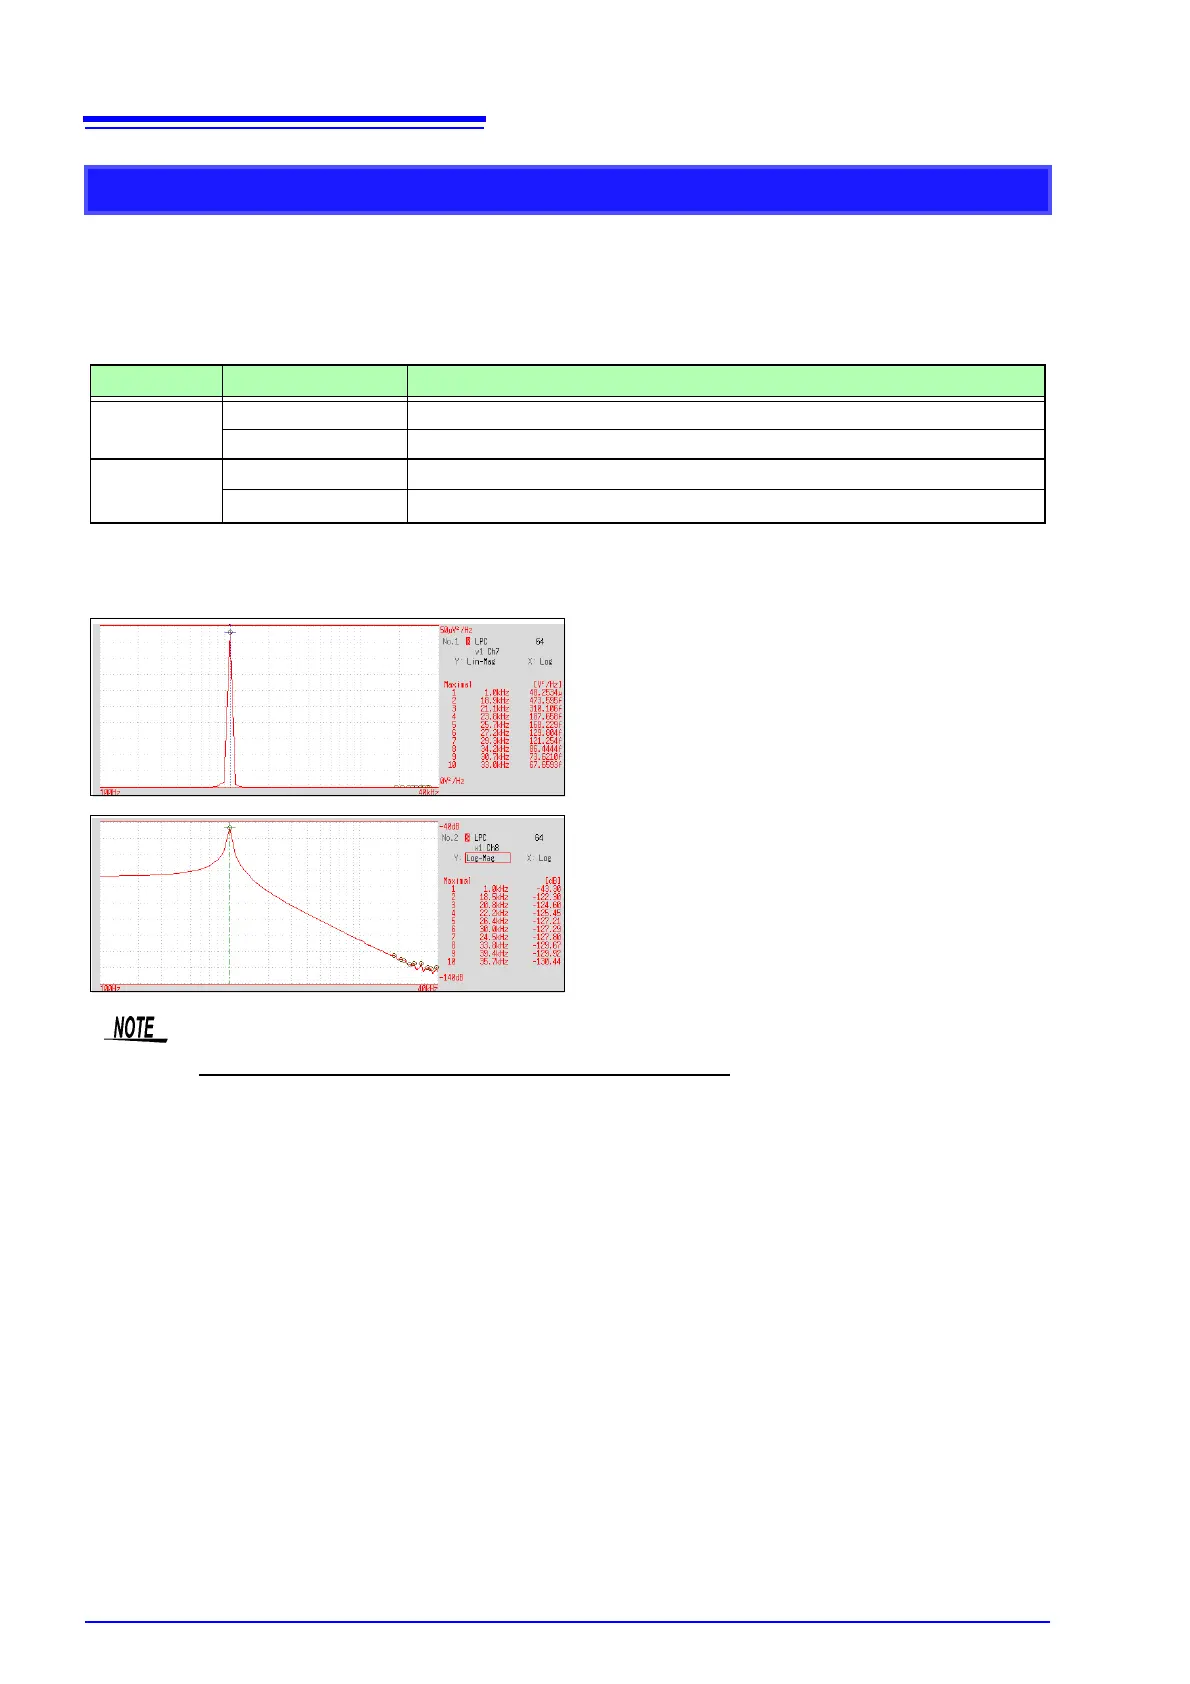
X axis: Log
Y axis: Log-Mag
• Always specify the order (from 2 to 64). Higher orders can expose finer spectral details.
• Amplitude values provided by LPC are not always the same as the power spectrum density.
• If an error occurs during analysis, no waveform is displayed.
• Noise-like phenomena can strongly affect the spectrum shape.
• Not available with external sampling enabled.
 Loading...