13.9 FFT Analysis Modes
243
13
Chapter 13 FFT Function
Waveform Example
Transfer Function
From the input and output signals, the transfer function (frequency characteristic) of a measurement
system can be obtained. It can also be displayed as a Nyquist plot.
Main uses:
• To inspect a filter’s frequency characteristic
• To inspect the stability of a feedback control system (using the Nyquist plot)
• To inspect the resonance characteristic of an object using an impulse hammer and pick-up sensor
See: About the Functions"13.9.2 Analysis Mode Functions" ( p.254), "Linear Time-Invariant Systems"( p.A16)
Axis Display Type Description
X axis
Linear Frequency is displayed with equal spacing
Log Frequency display of logarithm interval
Nyquist display
Displays the real-number component of the input-output ratio.
Y axis
Lin-Mag
Displays the input-output ratio linearly (dimensionless units).
Log-Mag(logarithm)
Displays the input-output ratio as dB values.
Lin-Real
Displays the real-number component of the input-output ratio (dimensionless
units).
Lin-Imag
Displays the imaginary component of the input-output ratio (dimensionless
units).
Nyquist display
Displays the imaginary component of the input-output ratio.
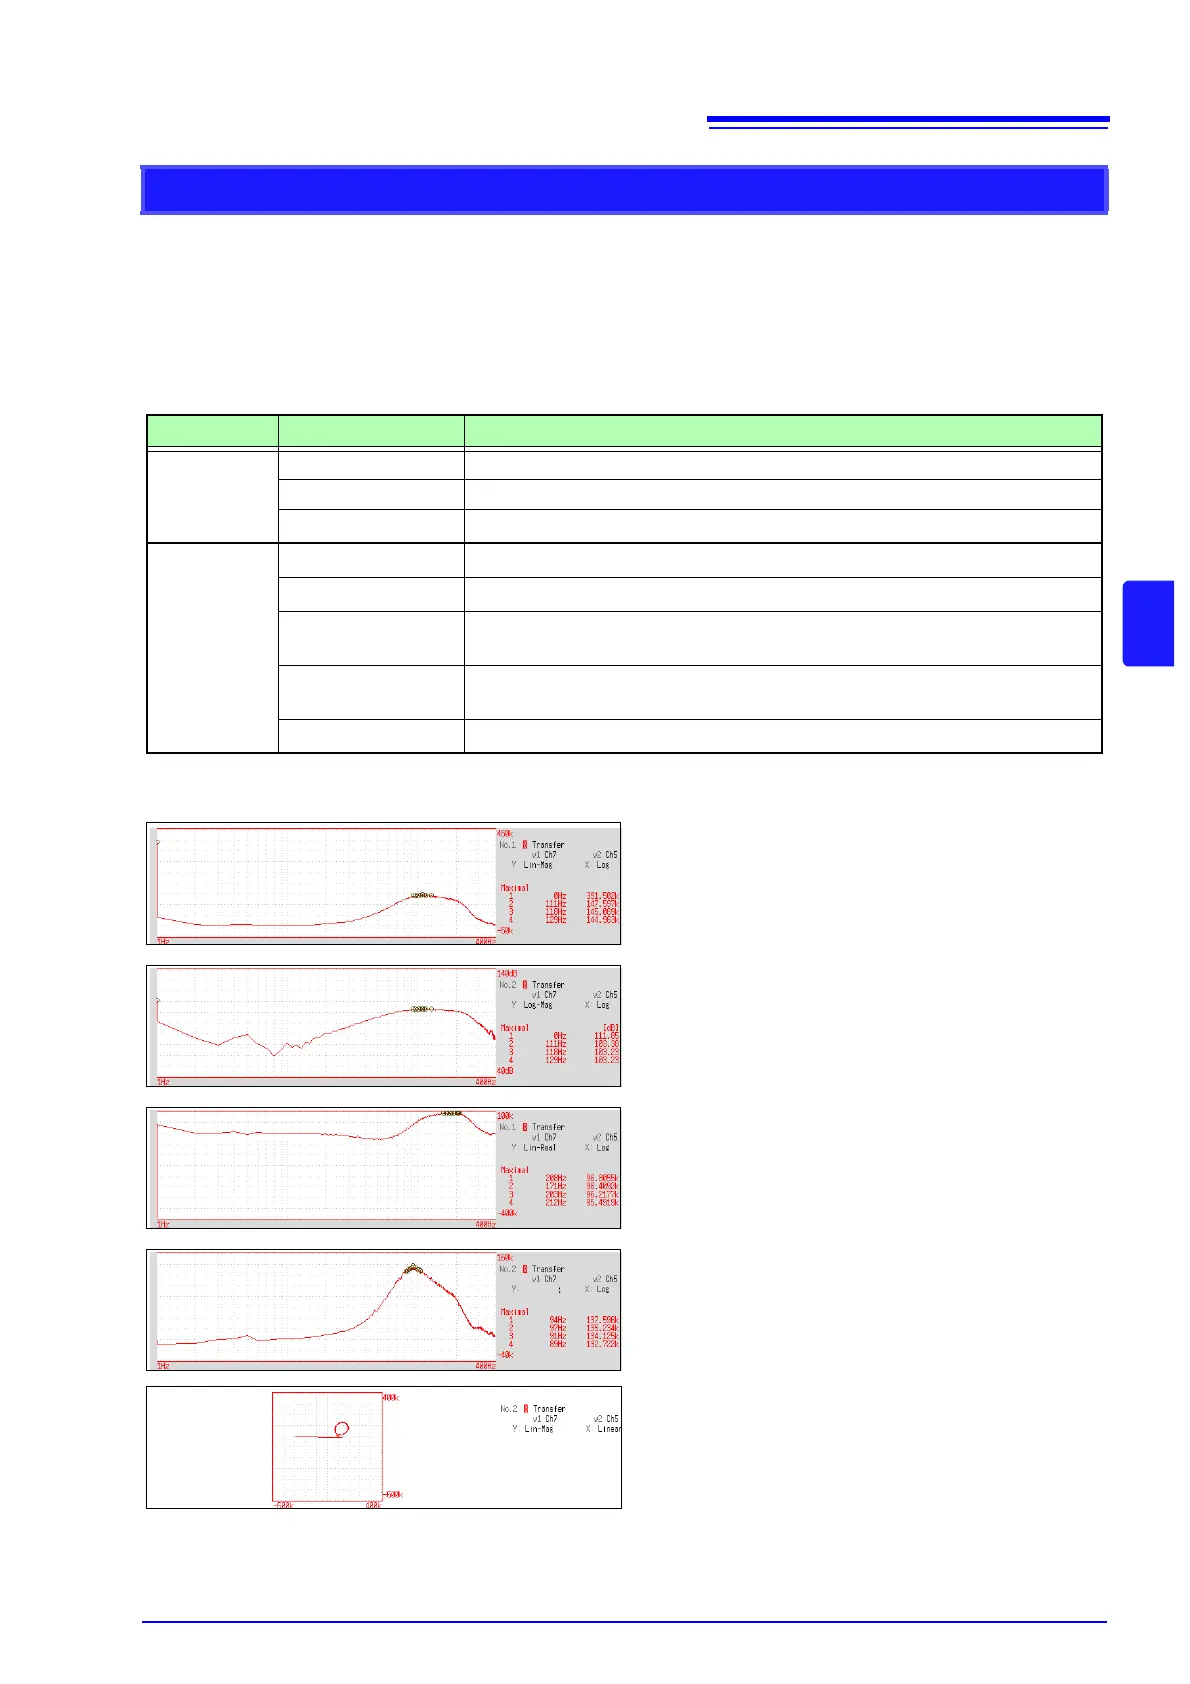
Normal display
X axis: Log
Y axis: Lin-Mag
Normal display
X axis: Log
Y axis: Log-Mag
Normal display
X axis: Log
Y axis: Lin-Real
Normal display
X axis: Log
Y axis: Lin-Imag
 Loading...