13.9 FFT Analysis Modes
244
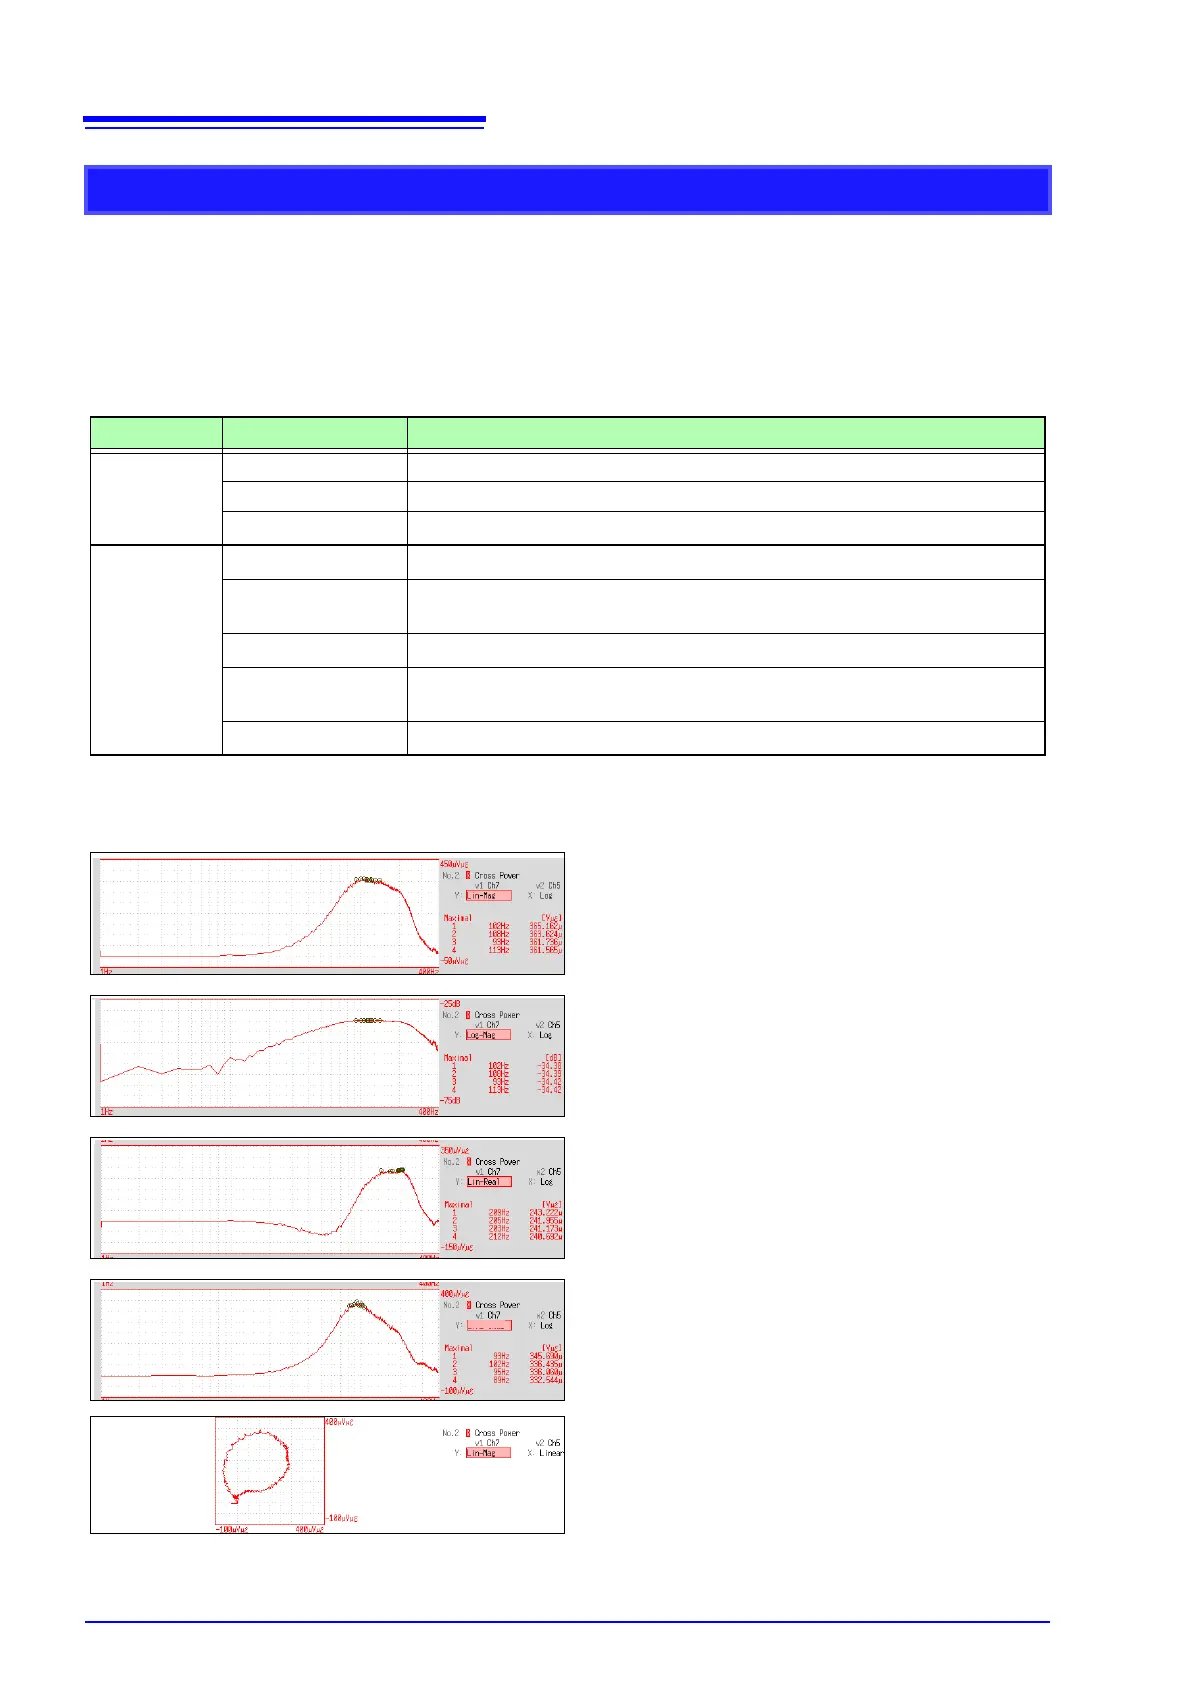
Waveform Example
Cross Power Spectrum
The product of the spectra of two input signals can be obtained. The common frequency components
of two signals can be obtained.
Using the voltage and current waveforms as input signals, active power, reactive power and apparent
power can be obtained at each frequency.
Main uses:
To inspect common frequency components of two signals
See: About the Functions"13.9.2 Analysis Mode Functions" ( p.254)
Axis Display Type Description
X axis
Linear Frequency is displayed with equal spacing
Log Frequency display of logarithm interval
Nyquist display
Displays the real-number component of the input-output ratio linearly.
Y axis
Lin-Mag
Displays the squared value of amplitude contents of analysis data linearly.
Log-Mag(logarithm)
Displays the amplitude contents of analysis data as dB values. (0 dB reference
value: 1eu
2
)*
Lin-Real
Displays the squared values of the real component of analysis data linearly.
Lin-Imag
Displays the squared values of the imaginary component of analysis data linear-
ly.
Nyquist display
Displays the imaginary component of analysis data linearly.
* eu: engineering units that are currently set are the standard (e.g., when the unit settings is volts, 0 dB = 1 V
2
)
Normal display
X axis: Log
Y axis: Lin-Mag
Normal display
X axis: Log
Y axis: Log-Mag
Normal display
X axis: Log
Y axis: Lin-Real
Normal display
X axis: Log
Y axis: Lin-Imag