13.9 FFT Analysis Modes
248
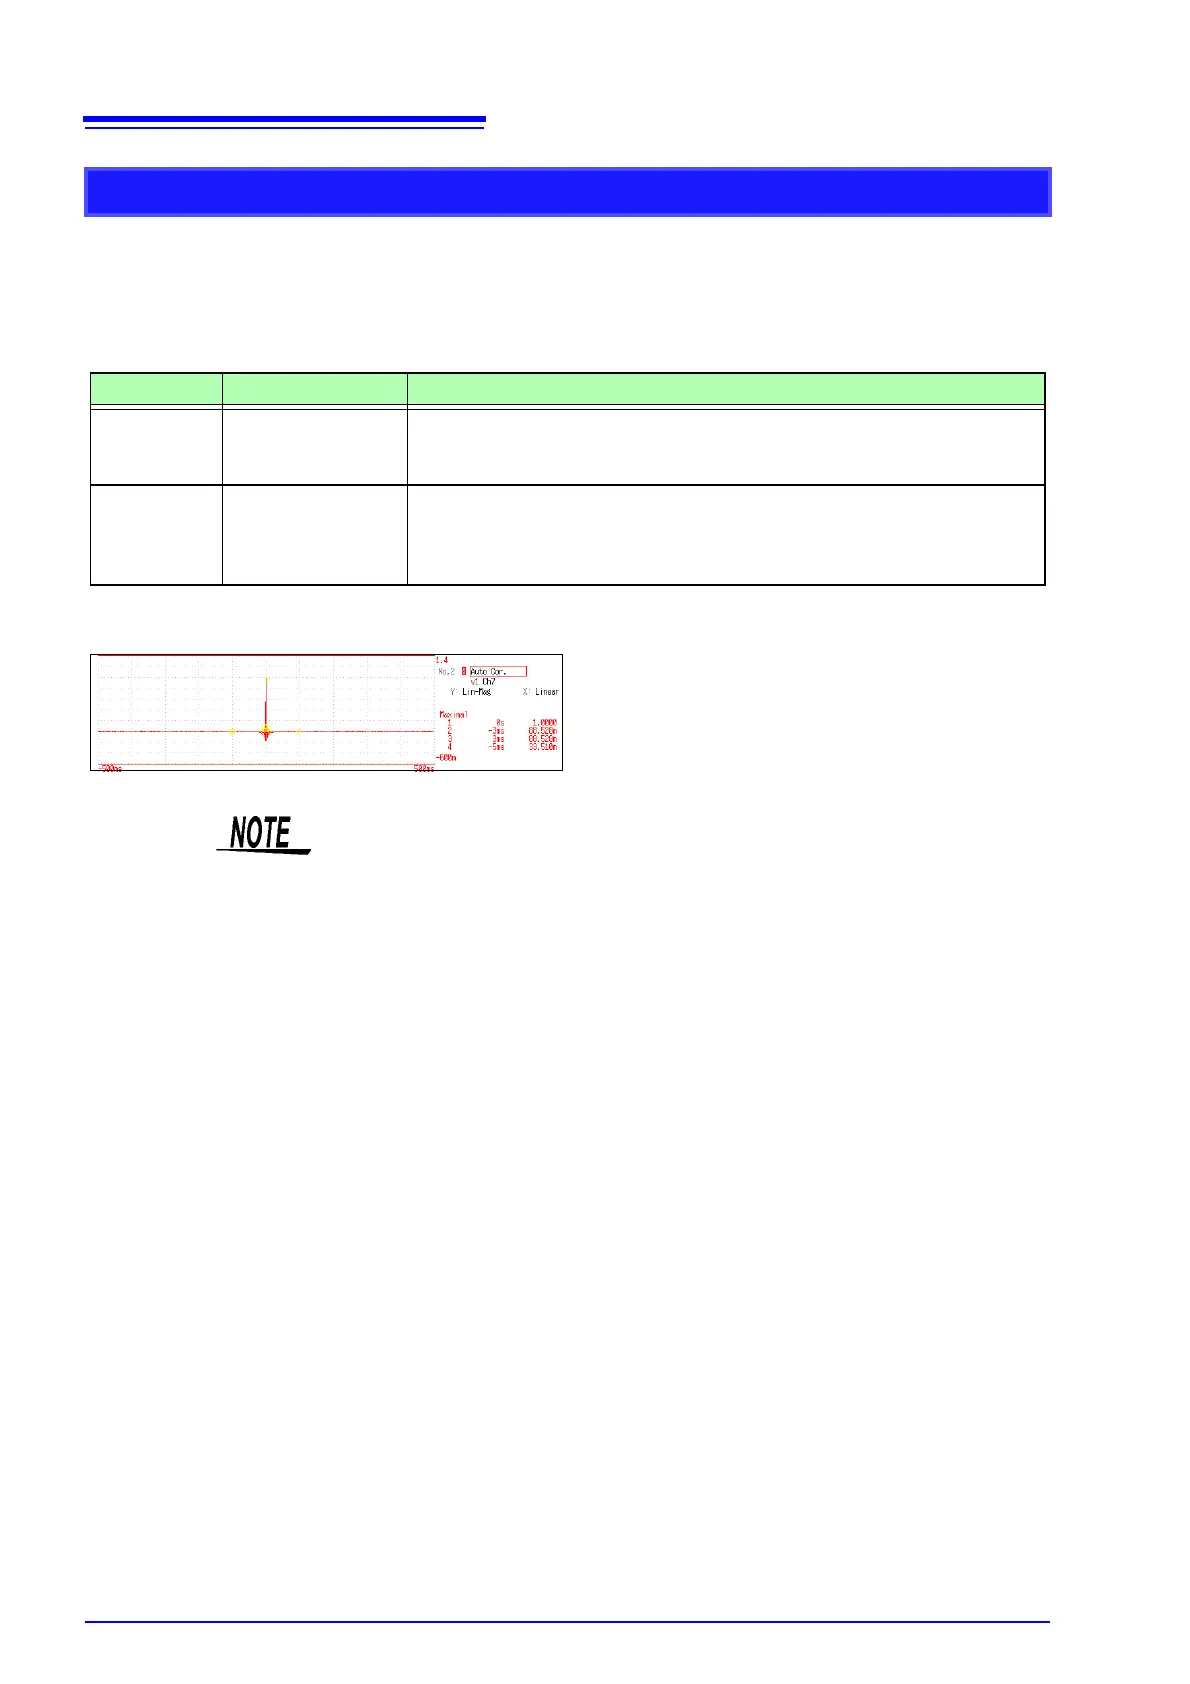
Waveform Example
Auto Correlation Function
Shows the correlation of two points on the input signal at time differential t.
Main uses:
• To detect periodicy in irregular signals (improving and detecting SNR)
• To inspect periodic components in a noisy waveform.
See: About the Functions"13.9.2 Analysis Mode Functions" ( p.254)
Axis Display Type Description
X axis Linear
Time display
The center (
t = 0) is the reference. To the right is lag time (+t), and to the left is
lead time (-
t)
Y axis Lin-Mag
+1 to -1 (dimensionless units)
The closest correlation at time differential
t is +1, and the least correlation is 0.
-1 indicates completely reversed polarity.
Because of the characteristics of the function, t = 0 becomes +1.
X axis: Linear
Y axis: Lin-Mag
This instrument provides a circular auto-correlation function. Analysis results are
normalized to the maximum value.