13.9 FFT Analysis Modes
249
13
Chapter 13 FFT Function
Waveform Example
Waveform Example
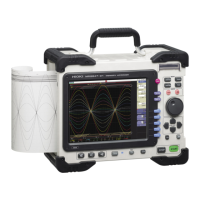
Cross-Correlation Function
Using two input signals, shows the correlation of two points on the input signal at time differential t.
Output is displayed as a function of differential time t.
Main uses:
• To determine the phase shift of two signals per unit of time
• To determine the speed and distance of time lag between two signals
See: About the Functions"13.9.2 Analysis Mode Functions" ( p.254)
Axis Display Type Description
X axis Linear
Time display
The center (t = 0) is the reference. To the right is lag time (+t), and to the left is
lead time (-t)
Y axis Lin-Mag
+1 to -1 is displayed in dimensionless units.
At time differential t, this value is +1 when the correlation of input and output sig-
nals is the closest, and 0 when correlation is the least. -1 indicates completely
reversed polarity.
X axis: Linear
Y axis: Lin-Mag
This instrument provides a circular cross-correlation function.
Analysis results are normalized to the maximum value.
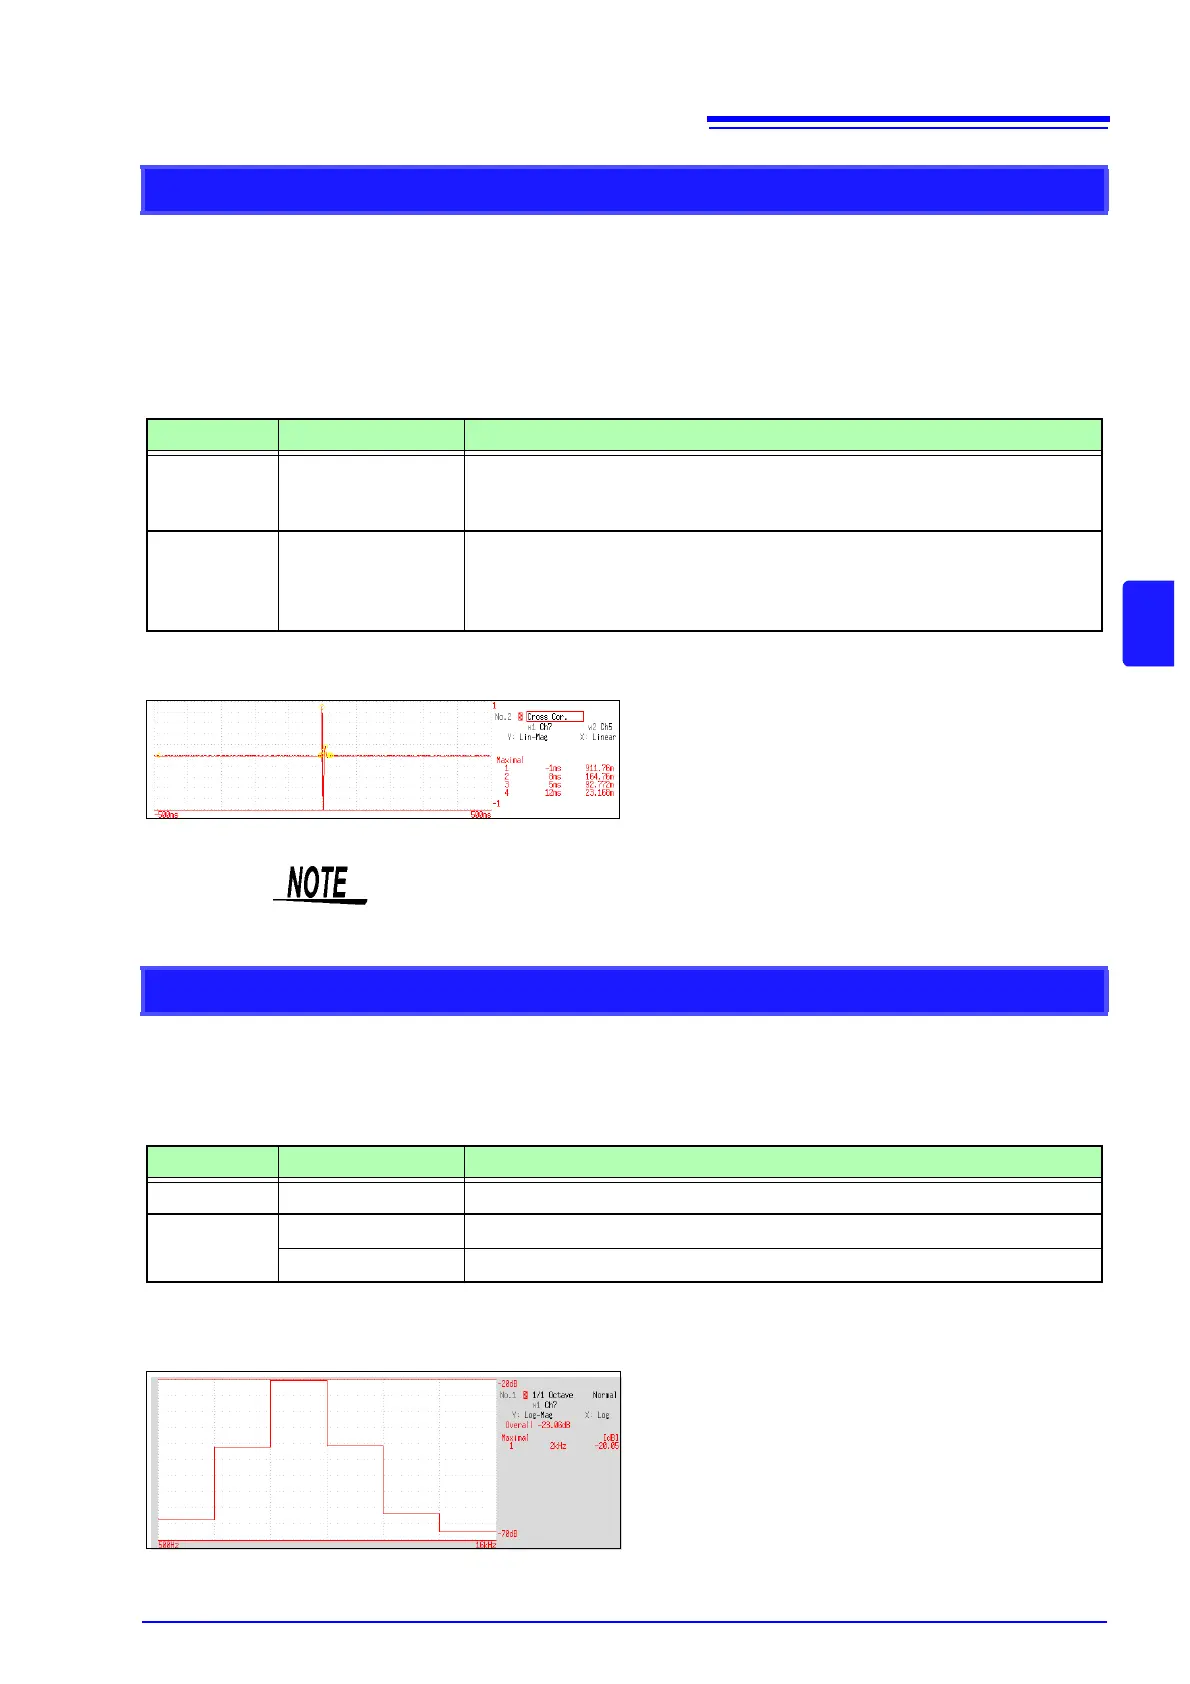
1/1 and 1/3 Octave Analysis
Analyze spectrums such as noise using fixed rate spectrum filters of 1/1 octave band or 1/3 octave band.
Main uses:
To analyze noise frequency
See: About the Functions"13.9.2 Analysis Mode Functions" ( p.254), "Octave Filter Characteristics"( p.A26)
Axis Display Type Description
X axis Log
Displays the center frequency of each band.
Y axis
Lin-Mag
Octave analysis values are displayed linearly.
Log-Mag
Octave analysis values are displayed as dB values. (0 dB reference value: 1eu)*
* eu: engineering units that are currently set are the standard (e.g., when the unit settings is volts, 0 dB = 1 V)
1/1 Octave
X axis: Log
Y axis: Log-Mag
Filter: Normal