13.9 FFT Analysis Modes
250
Octave Analysis
Octave analysis consists of frequency analysis of the signal passed through a constant-width band-pass filter.
The power spectrum displays the power level in each subband after dividing the spectrum into fixed-width
segments (subbands), while octave analysis scales the spectrum logarithmically and displays each octave
(subband) as a bar graph.
The center frequency of the octave bands and filter characteristics are determined according to IEC61260
standards. With this instrument, 1/1- and 1/3-octave analyses are calculated using power spectrum Analysis
results.
1/1 Octave Analysis: 6 subbands
1/3 Octave Analysis: 16 subbands
The octave analysis results of this unit are displayed based on the oscillation level as a reference. Therefore,
when only sine waves are input, the value doubles (3.01 dB) versus the overall value. To directly read by
energy base, adjust the level by the setting scaling in advance.
See: "8.5 Converting Input Values (Scaling Function)" ( p.128)
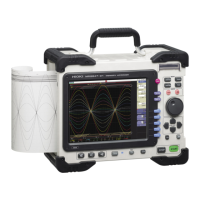
1/1 Octave
X axis: Log
Y axis: Log-Mag
Filter: Sharp
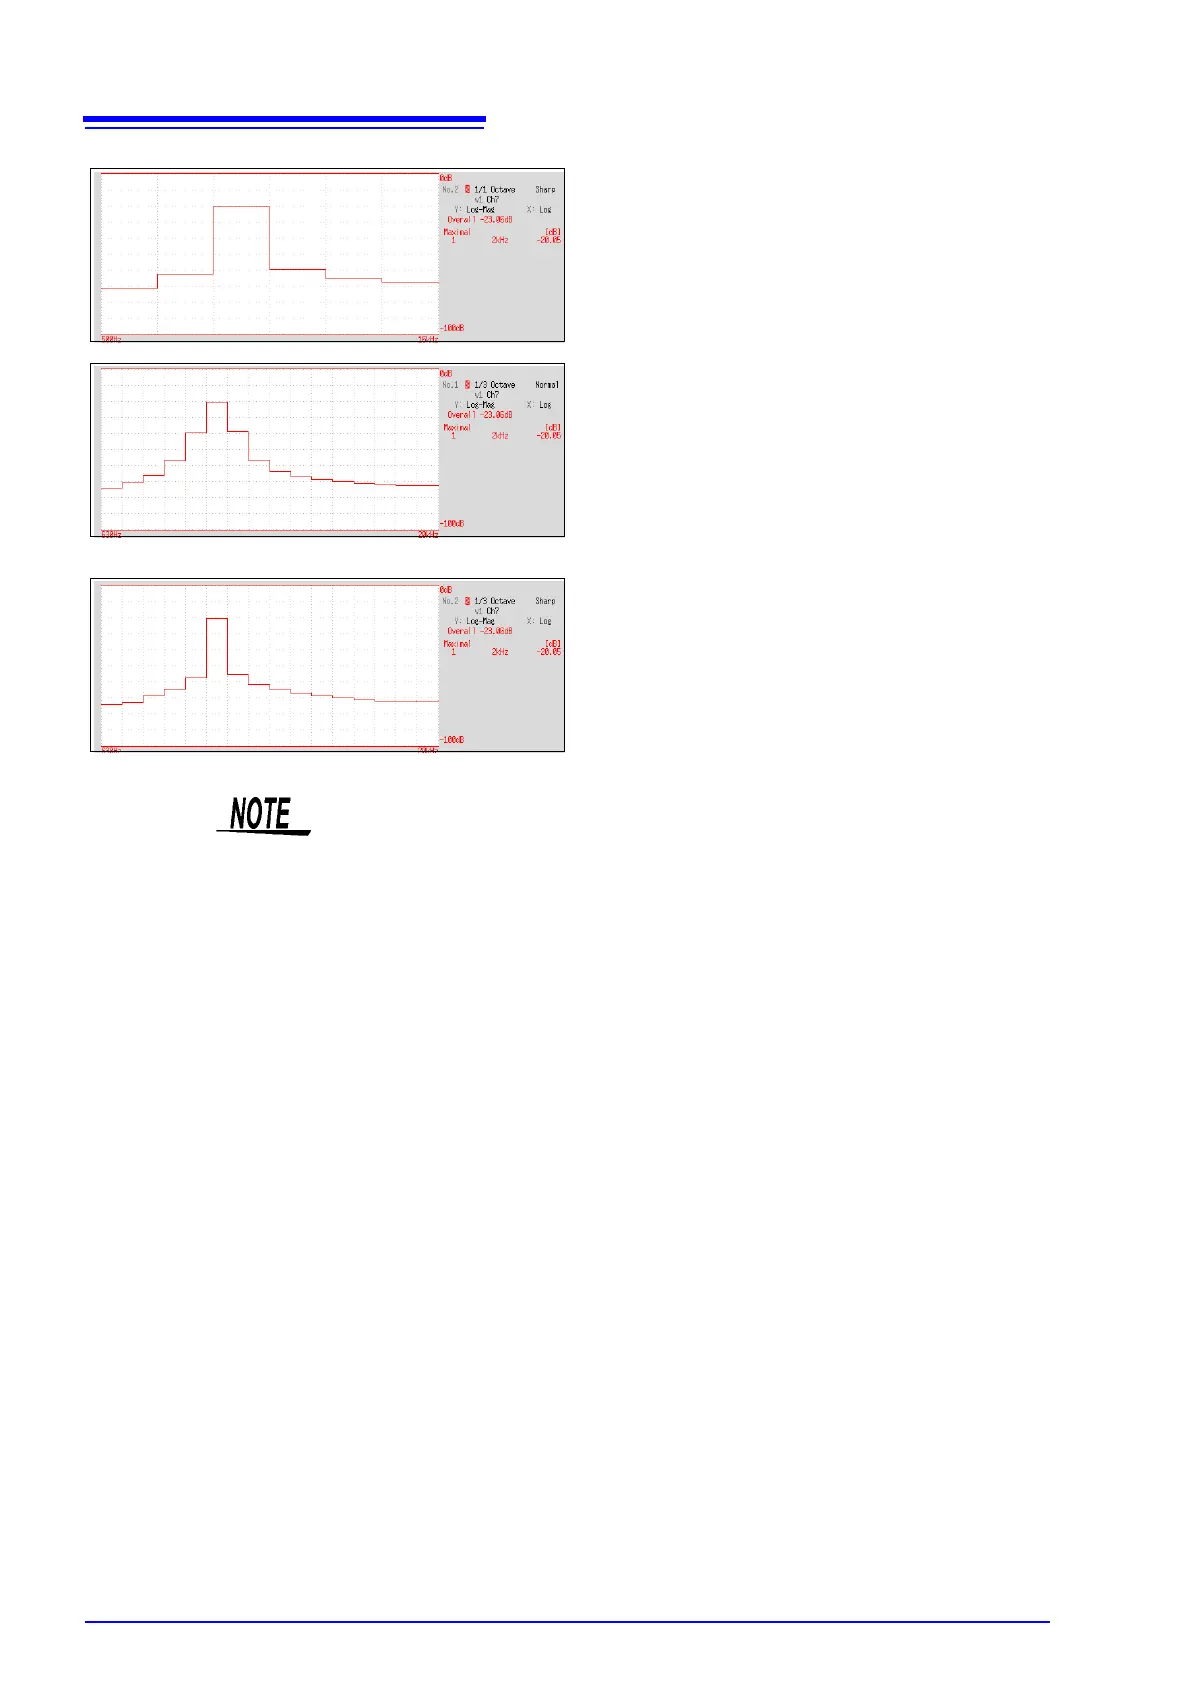
1/3 Octave
X axis: Log
Y axis: Log-Mag
Filter: Normal
1/3 Octave
X axis: Log
Y axis: Log-Mag
Filter: Sharp
Not available with external sampling enabled.
 Loading...