9/29/09 System 824 Views 5-7
Status - Status represents the state of the instrument (as
described at the beginning of this section).
SPL history graph - This shows one second Leq readings.
The far right bar displays the current SPL readings. As
readings are taken, they are placed onto the scrolling graph
from right to left every second. The time axis, in the SPL
history graph, shows time increasing from left to right.
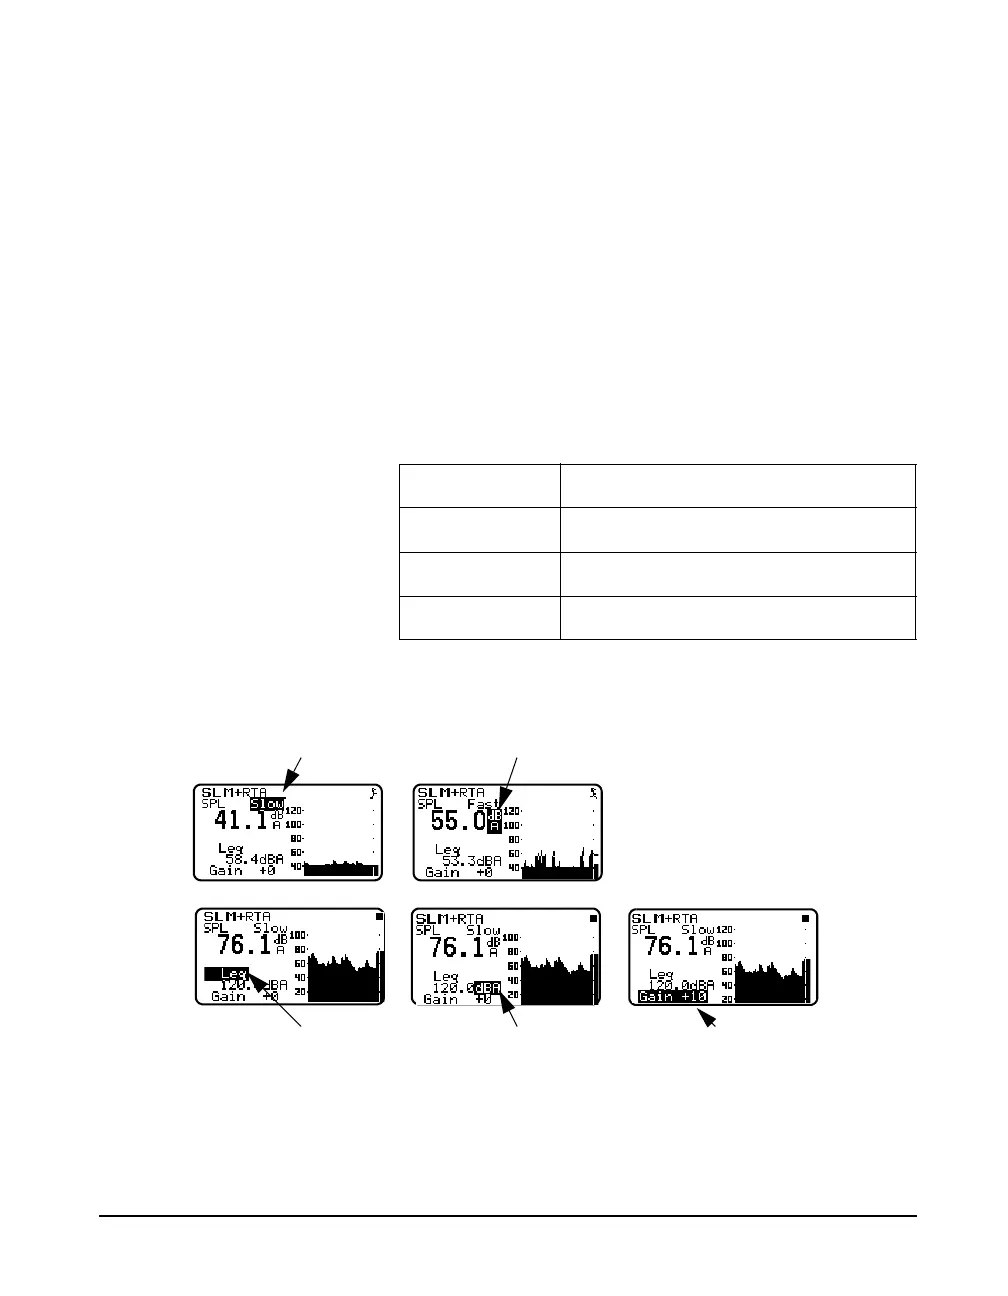
You can use the arrow keys to select the detector, weighting,
secondary parameter to be displayed and gain or range as
shown below.
Key Action
d Moves to the next setting
u Moves to the previous setting
l or r Adjusts the current setting
Detector
(Fast, Slow, Impulse)
Weighting
(A, C, or Flat)
Secondary Parameter
(L
eq
, SEL, L
min
, L
max
, L
pk
)
Secondary Weighting
(A, C, or Flat)
Gain
(0, +10, +20, +30, +40, +50